There are several options for creating and selecting charts, and these are accessed in the "Chart Options" pane.
>> To open the Chart Options pane
➢ Once you've tapped on the Charts tab in the TAB Bar to open the "Selected Charts" pane (see Charts), tap on the Chart Details themselves to get a list of options for selecting that chart.
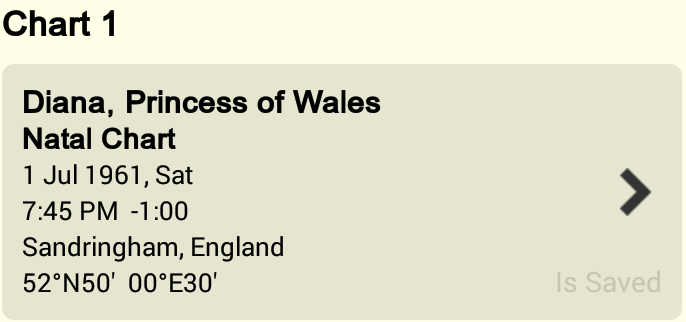 |
This opens the "Chart 1", "Chart 2", or "Chart 3" Options pane (depending on which chart's details you tapped on). To return to the "Selected Charts" pane tap on the Return Arrow  in the top left corner.
|
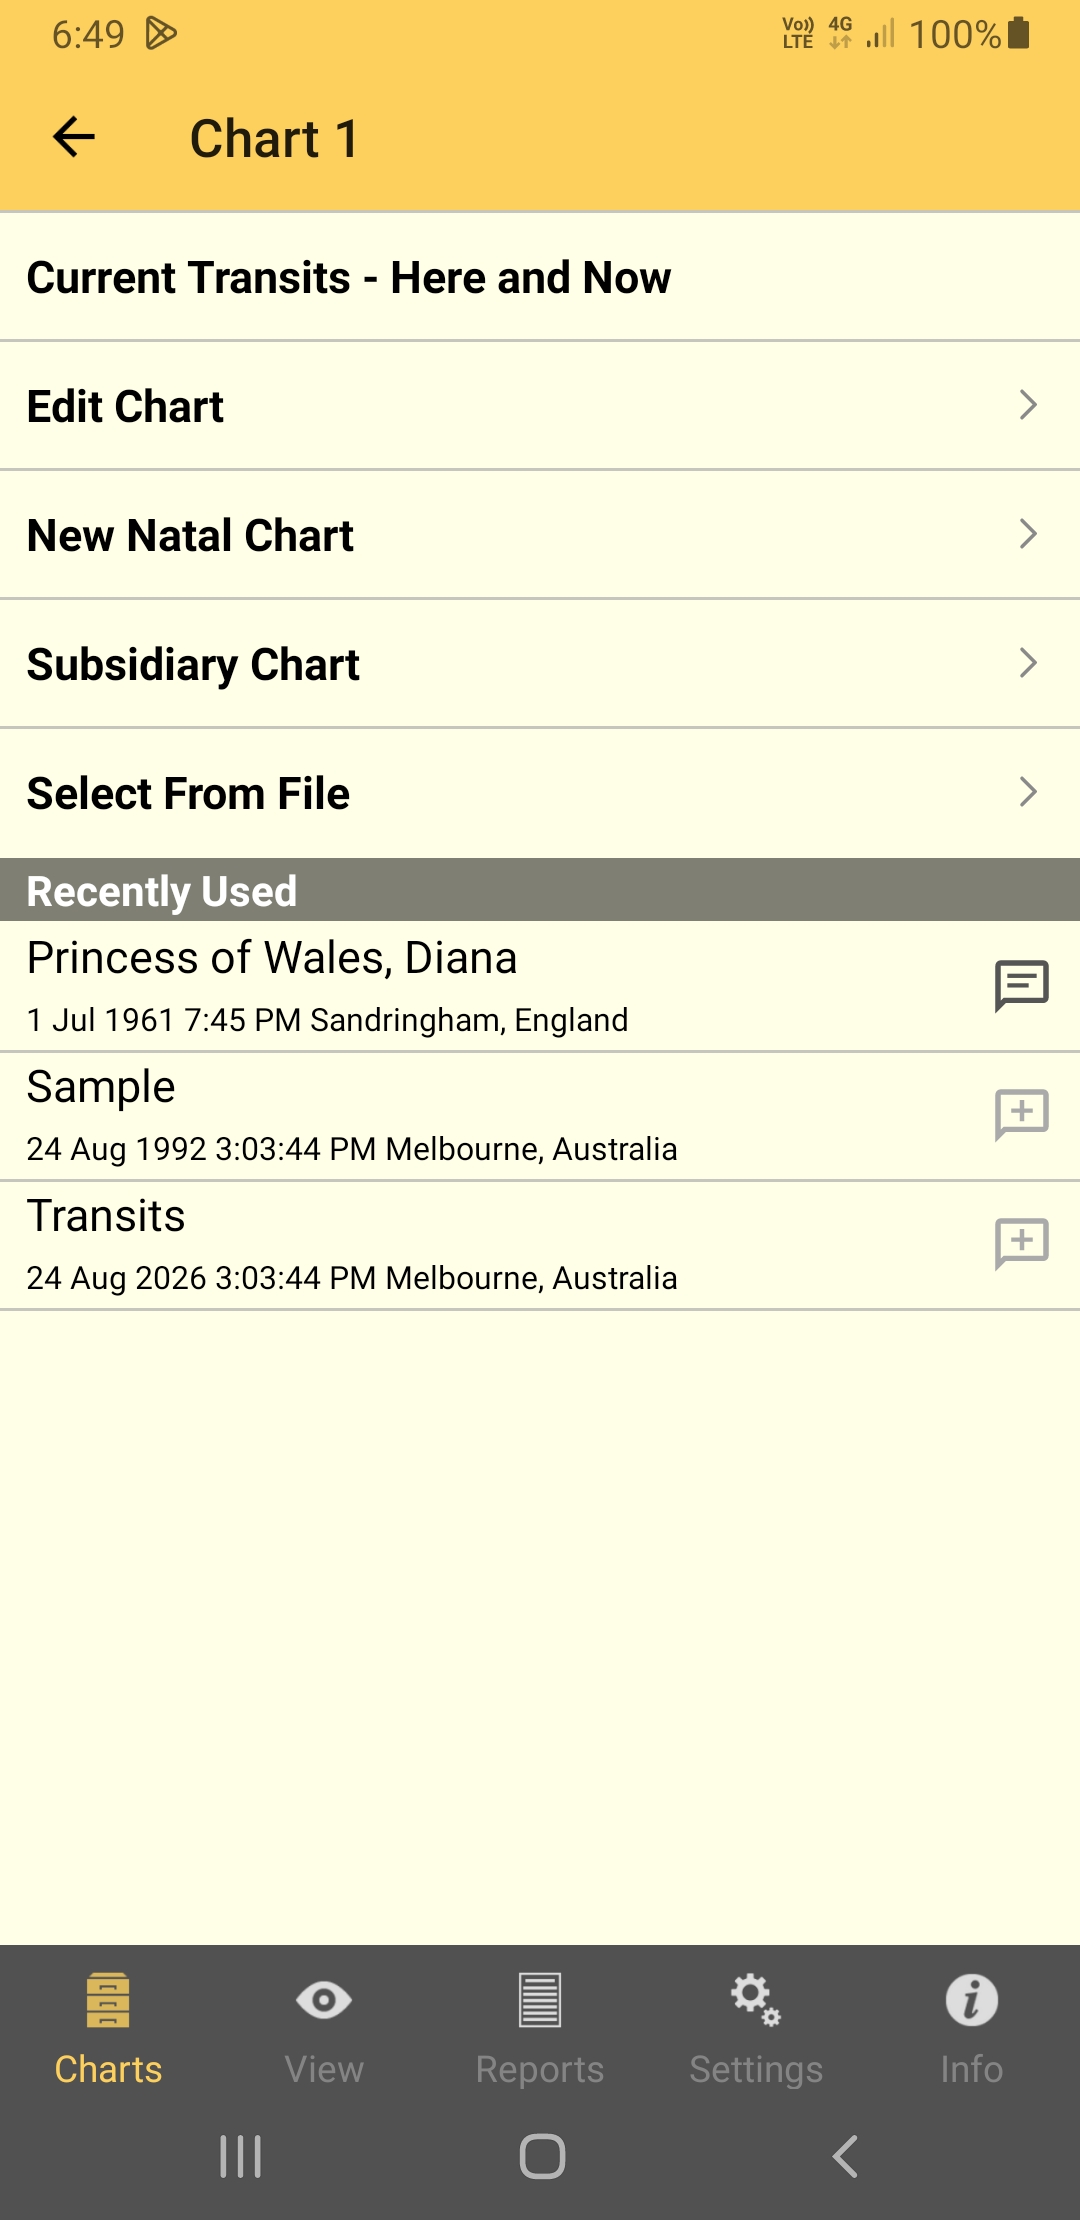 Chart Options
|
In the "Chart Options" pane for "Chart 1", "Chart 2" or "Chart 3" the options include:
•Current Transits - Here and Now
Tapping on this creates a chart for the "Home Location" for the current time. You are automatically returned to the "Selected Charts" pane. This chart will by default be an "Event" type of chart.
•Edit Chart
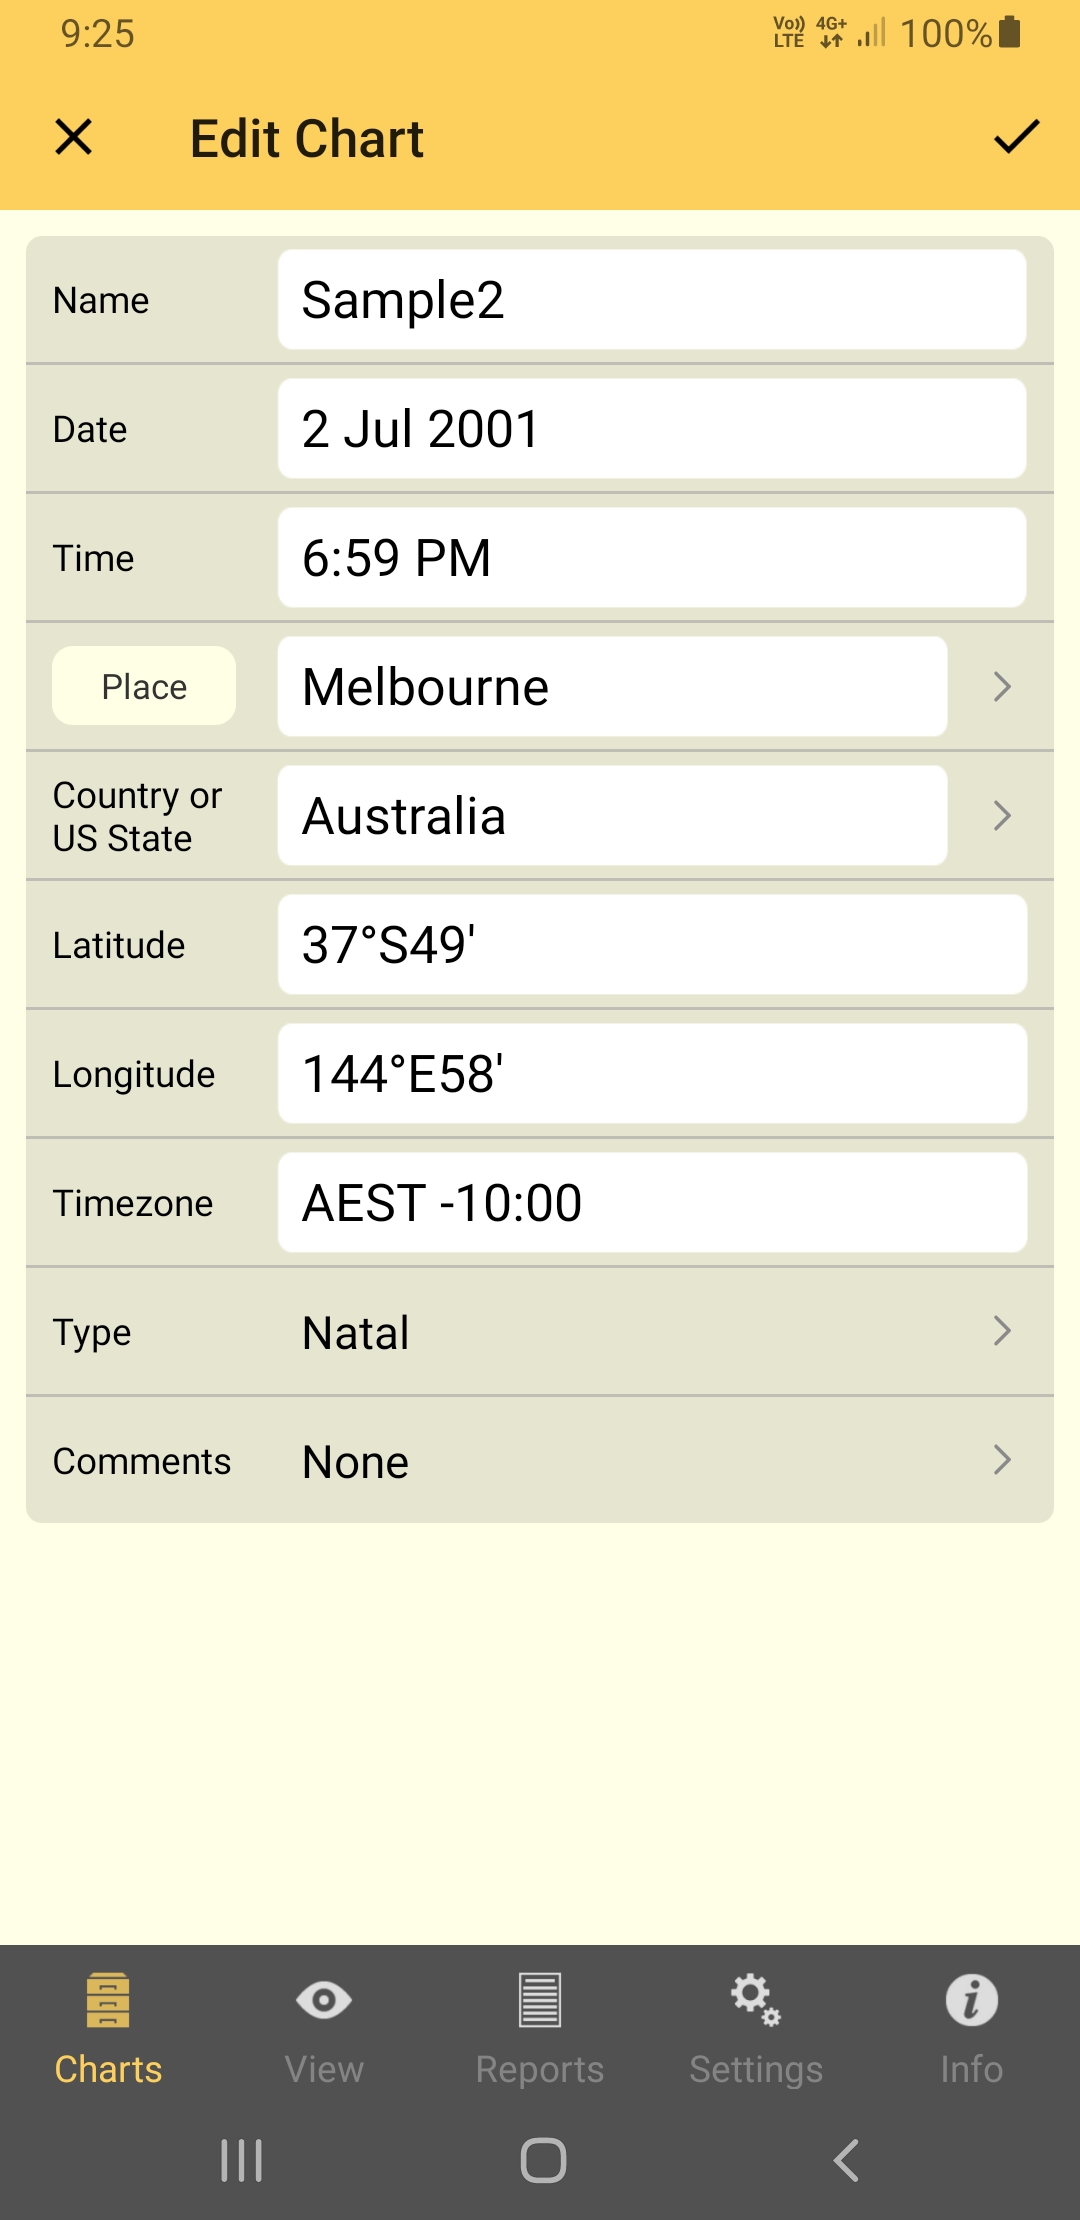
Tapping on this opens the "Edit Chart" pane, where you can edit the chart details. Swipe the screen up and down to see all the fields. To edit a field tap in it's text box and edit the data using the keyboard. Once you have finished edited a field tap in a different field to edit that.
TIP: To jump straight to the next field tap on the Next key at the bottom right of the keyboard. Once you reach the last field the "Next" key will change into Done, and tapping that closes the keyboard.
 Editing a chart |
Date
For the date you may optionally enter "NS" or "OS" as a suffix to the date to force date period recognition. If you don't do this Astro Gold assumes that the dates that you enter...
•on or before 14th October 1582 are in the old style (OS / Julian) calendar.
•on or after 15th October 1582 are in the new style (NS / Gregorian) calendar.
The Gregorian calendar was not adopted everywhere at the same time. Sometimes dates after 15th October 1582 are given in terms of the old style calendar (often followed by the initials "OS"). Also, some sources convert pre 1582 dates to new style dates (often followed by the initials NS).
>> To enter calendar dates expressed out of period
➢ If you wish to enter a date on or after the 15th October 1582 which is expressed as an old style date, then add the suffix “OS” to the entered date (e.g. 17 Dec 1723 OS). This will be autocorrected to display the corresponding date in the new style calendar.
➢ If you wish to enter a date before the 15th October 1582 which is expressed as a new style date, then add the suffix “NS” to the entered date (e.g. 7 Jan 1503 NS). This will be autocorrected to display the corresponding date in the old style calendar.
1)For "Country" and "Place" you can also tap on the > icon at the right of the text box and select a value off a list by tapping on it. Swipe up and down, or tap on a letter in the Index on the right, to find the state or country you want. Once you've done this the list will automatically close and return you to the "Edit Chart" pane, or you can tap the Return Arrow in top left of the screen.
➢ When you have finished editing the chart details either tap on the Go  icon in the top right corner of the screen, or the Cancel
  icon in the top left hand corner of the screen.
1)Tapping the Charts tab opens the "Selected Charts" pane, then tapping on a chart's details brings you to the "Chart Options" pane.
2)Then tapping on New Natal Chart opens the "New Natal Chart" pane, where you can enter the new chart's details.
It functions exactly like the "Edit Chart" pane described above, except values for the fields are automatically pre-selected so creating a new chart is potentially fast and super easy.
The pre-selections are simply the same values used in each field for the last chart that was created. You can overwrite these pre-selected values if you need to - just type in something different. You can also give the chart a type – either "Natal" (the default), or "Male", "Female", "Event", or "Horary".
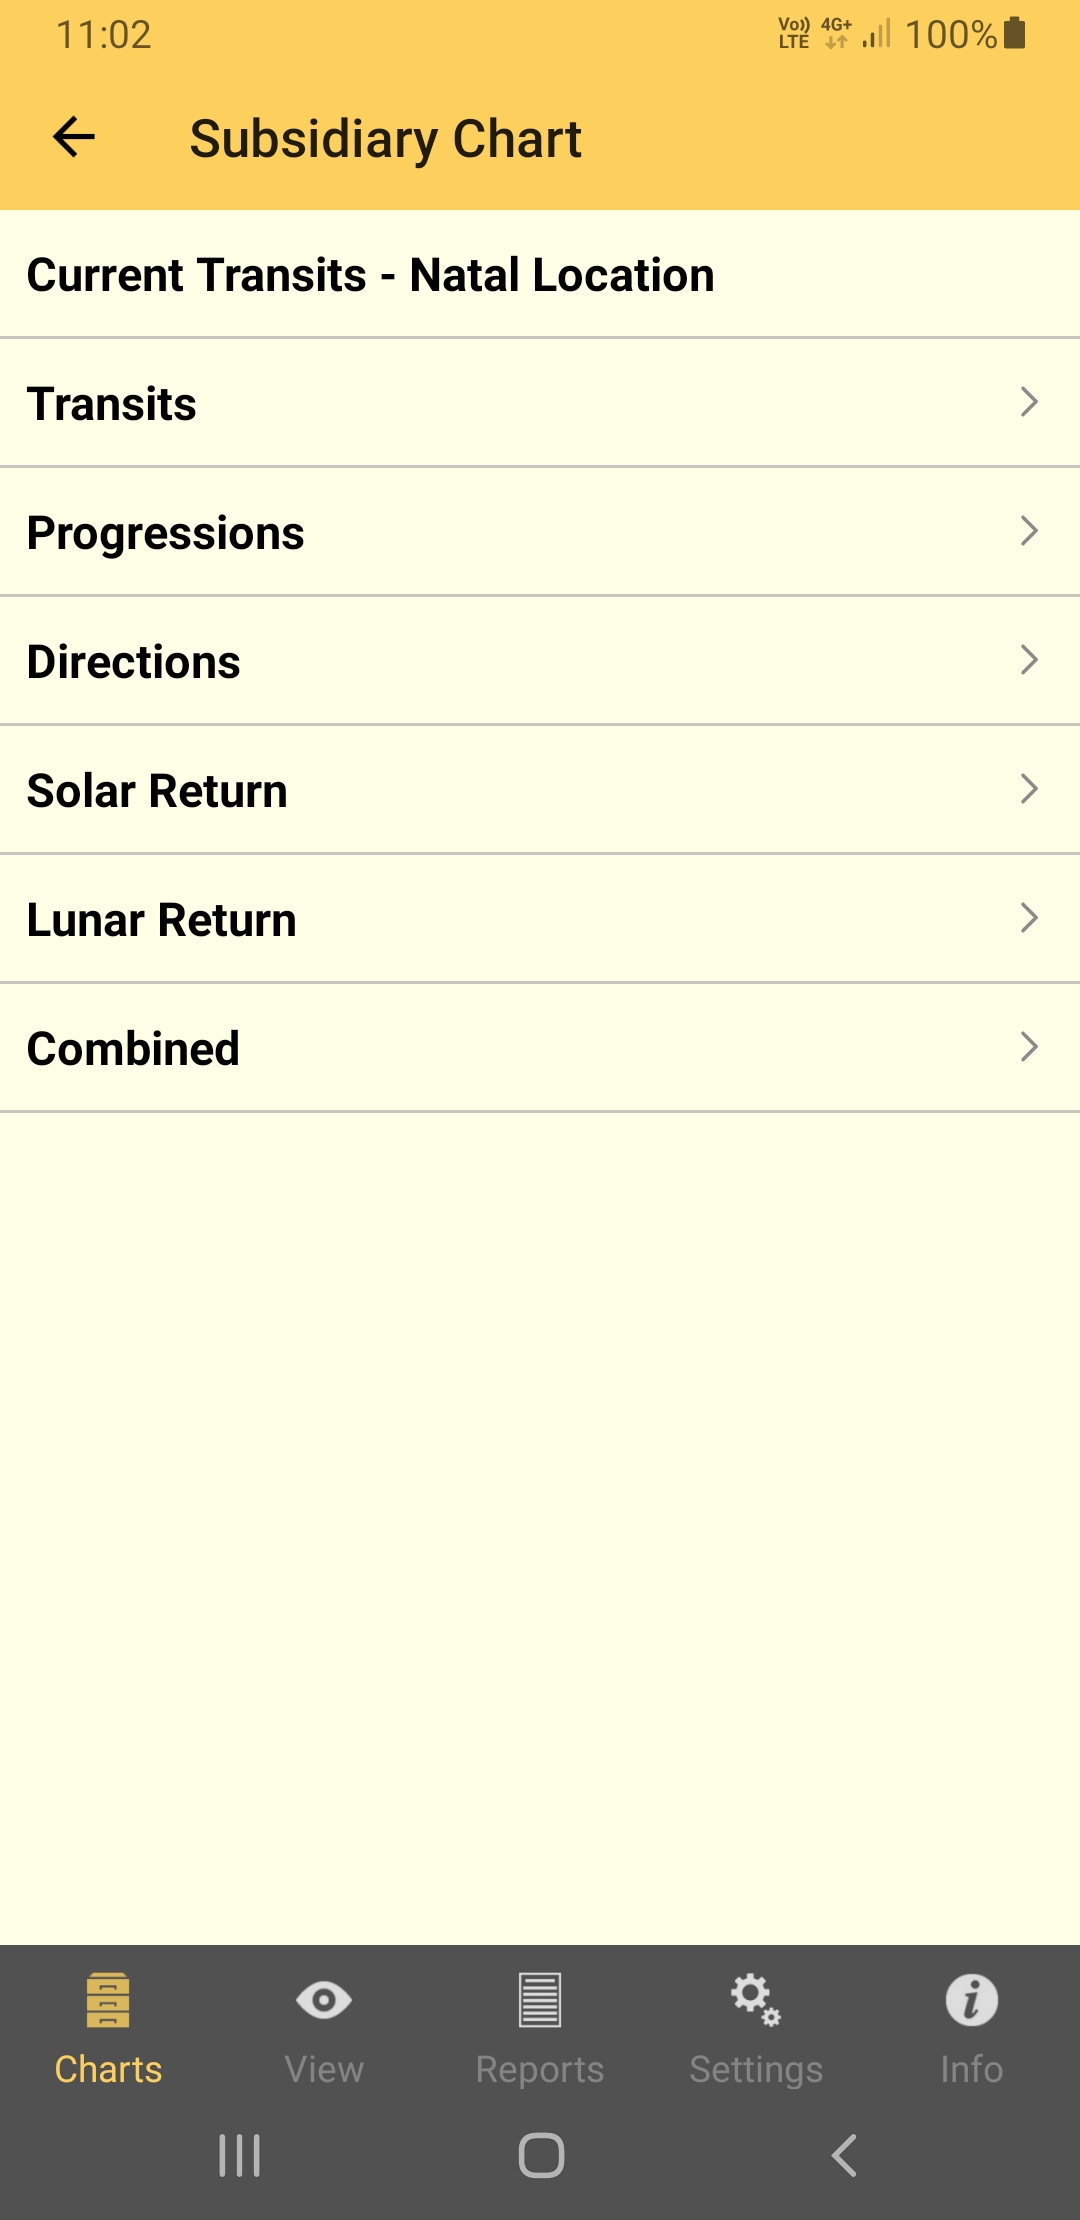
From the "Chart Options" pane tapping on this opens the "Subsidiary Chart" pane where you can create a new chart that is derived from the chart you are currently working with. The chart will be given a chart type reflecting that kind of subsidiary chart e.g. for a solar return chart the chart type will be "Solar Return".
To quit from the "Subsidiary Chart" pane without making a selection tap on the Return Arrow in the top left corner of the pane.
 Creating a subsidiary chart |
The different items available for subsidiary charts are:
•Current Transits - Natal Location
Tapping on this simply replaces the chart with the current chart for the Home Location, and returns you to the "Selected Charts" option.
•Progressions
Tapping on this opens the "Progressions" pane where you can...
1)Tap on the Type dropdown list to display the type of Progressions you can use:
•Secondary Progressions
•Tertiary (Mean) Progressions
•Tertiary (True) Progressions
•Minor Progressions.
2)Tap on which type you want to be active and it will be ticked on the right hand side, and you will be returned to the "Progressions" pane.
3)Enter the Date and Time for the progressed chart by tapping in those text boxes so the keyboard appears and then type them in. When you are finished typing tap on Next or Done in the bottom right corner of the pane.
4)Select the Location by sliding the round "Use Natal" slider button, on the right-hand side, into the on or off position. Dragging it to the right turns it ON and it becomes yellow. Dragging it to the left turns it OFF and it becomes gray. If you turned it off then tapping on the location which is just underneath the "Use Natal" setting displays Place fields where you can select or enter the place to use. Entering data in these fields is exactly the same as for creating a new chart or editing a chart (see Country and Place above). Tap on the Return Arrow to return to the "Subsidiary" pane.
Once you have completed the above tap on the Go  icon in the top right corner of the pane to cast the progressed chart, and be returned to the "Selected Charts" pane.
To cancel casting a progressed chart tap on the Cancel icon in the top left corner.
▪Directions
Tapping on this opens the "Directions" pane where you can:
1)Tap on the Type dropdown list to display the type of Directions you can use:
•Solar Arc Directions
•Ascendant Arc Directions
•Vertex Directions
•Profections Sign/yr
•Profections Sign/mo
•Profections Wholesign/yr
•Profections Wholesign/mo
•Primary van Dam
2)Tap on which type you want to be active and it will be ticked on the right hand side, and you will be returned to the "Directions" pane.
3)Enter the Date and Time for the directions by tapping in those text boxes so the keyboard appears and then type them in.
4)Select the Location by sliding the round "Use Natal" slider button, on the right-hand side, into the on or off position. Dragging it to the right turns it ON and it becomes yellow. Dragging it to the left turns it OFF and it becomes gray. If you turned it off then tapping on the location which is just underneath the "Use Natal" setting displays Place fields where you can select or enter the place to use. Entering data in these fields is exactly the same as for creating a new chart or editing a chart (see Country and Place above). Tap on the Return Arrow to return to the "Subsidiary" pane.
Once you have completed the above tap on the Go icon in the top right corner of the pane to cast the solar arc directed chart, and be returned to the "Selected Charts" pane.
To cancel casting a directed chart tap on the Cancel icon in the top left corner.
▪Solar Return
Tapping on this opens the "Cast Solar Return" pane where you can:
1)Tap on the Which Return dropdown list to display the list. It will display every return possible for 100 years of life.
2)Tap which Year/Age point in the list you want to cast the solar return for.
3)Select the Location by sliding the round "Use Natal" slider button, on the right-hand side, into the on or off position. Dragging it to the right turns it ON and it becomes yellow. Dragging it to the left turns it OFF and it becomes gray. If you turned it off then tapping on the location which is just underneath the "Use Natal" setting displays Place fields where you can select or enter the place to use. Entering data in these fields is exactly the same as for creating a new chart or editing a chart (see Country and Place above). Tap on the Return Arrow to return to the "Subsidiary" pane.
Once you have completed the above tap on the Go icon in the top right corner of the pane to cast the Solar Return chart, and be returned to the "Selected Charts" pane.
To cancel casting a solar return chart tap on the Cancel icon in the top left corner.
▪Lunar Return
Tapping on this opens the "Lunar Return" pane where you can:
1)Tap on the Which Return dropdown list to display the three options.
2)Tap on either Current, Nearest or Next.
3)Enter the Date and Time for the solar return by tapping in those text boxes so the keyboard appears and then type them in.
4)Select the Location by sliding the round "Use Natal" slider button, on the right-hand side, into the on or off position. Dragging it to the right turns it ON and it becomes yellow. Dragging it to the left turns it OFF and it becomes gray. If you turned it off then tapping on the location which is just underneath the "Use Natal" setting displays Place fields where you can select or enter the place to use. Entering data in these fields is exactly the same as for creating a new chart or editing a chart (see Country and Place above). Tap on the Return Arrow to return to the "Subsidiary" pane.
Once you have completed the above tap on the Go icon in the top right corner of the pane to cast the secondary progressed chart, and be returned to the "Selected Charts" pane.
To cancel casting a solar return chart tap on the Cancel icon on in the top left corner.
If you have only selected one chart tapping on this brings up a message saying you need two charts to combine. If you have selected two charts then tapping on this brings up the "Cast Combined" pane.
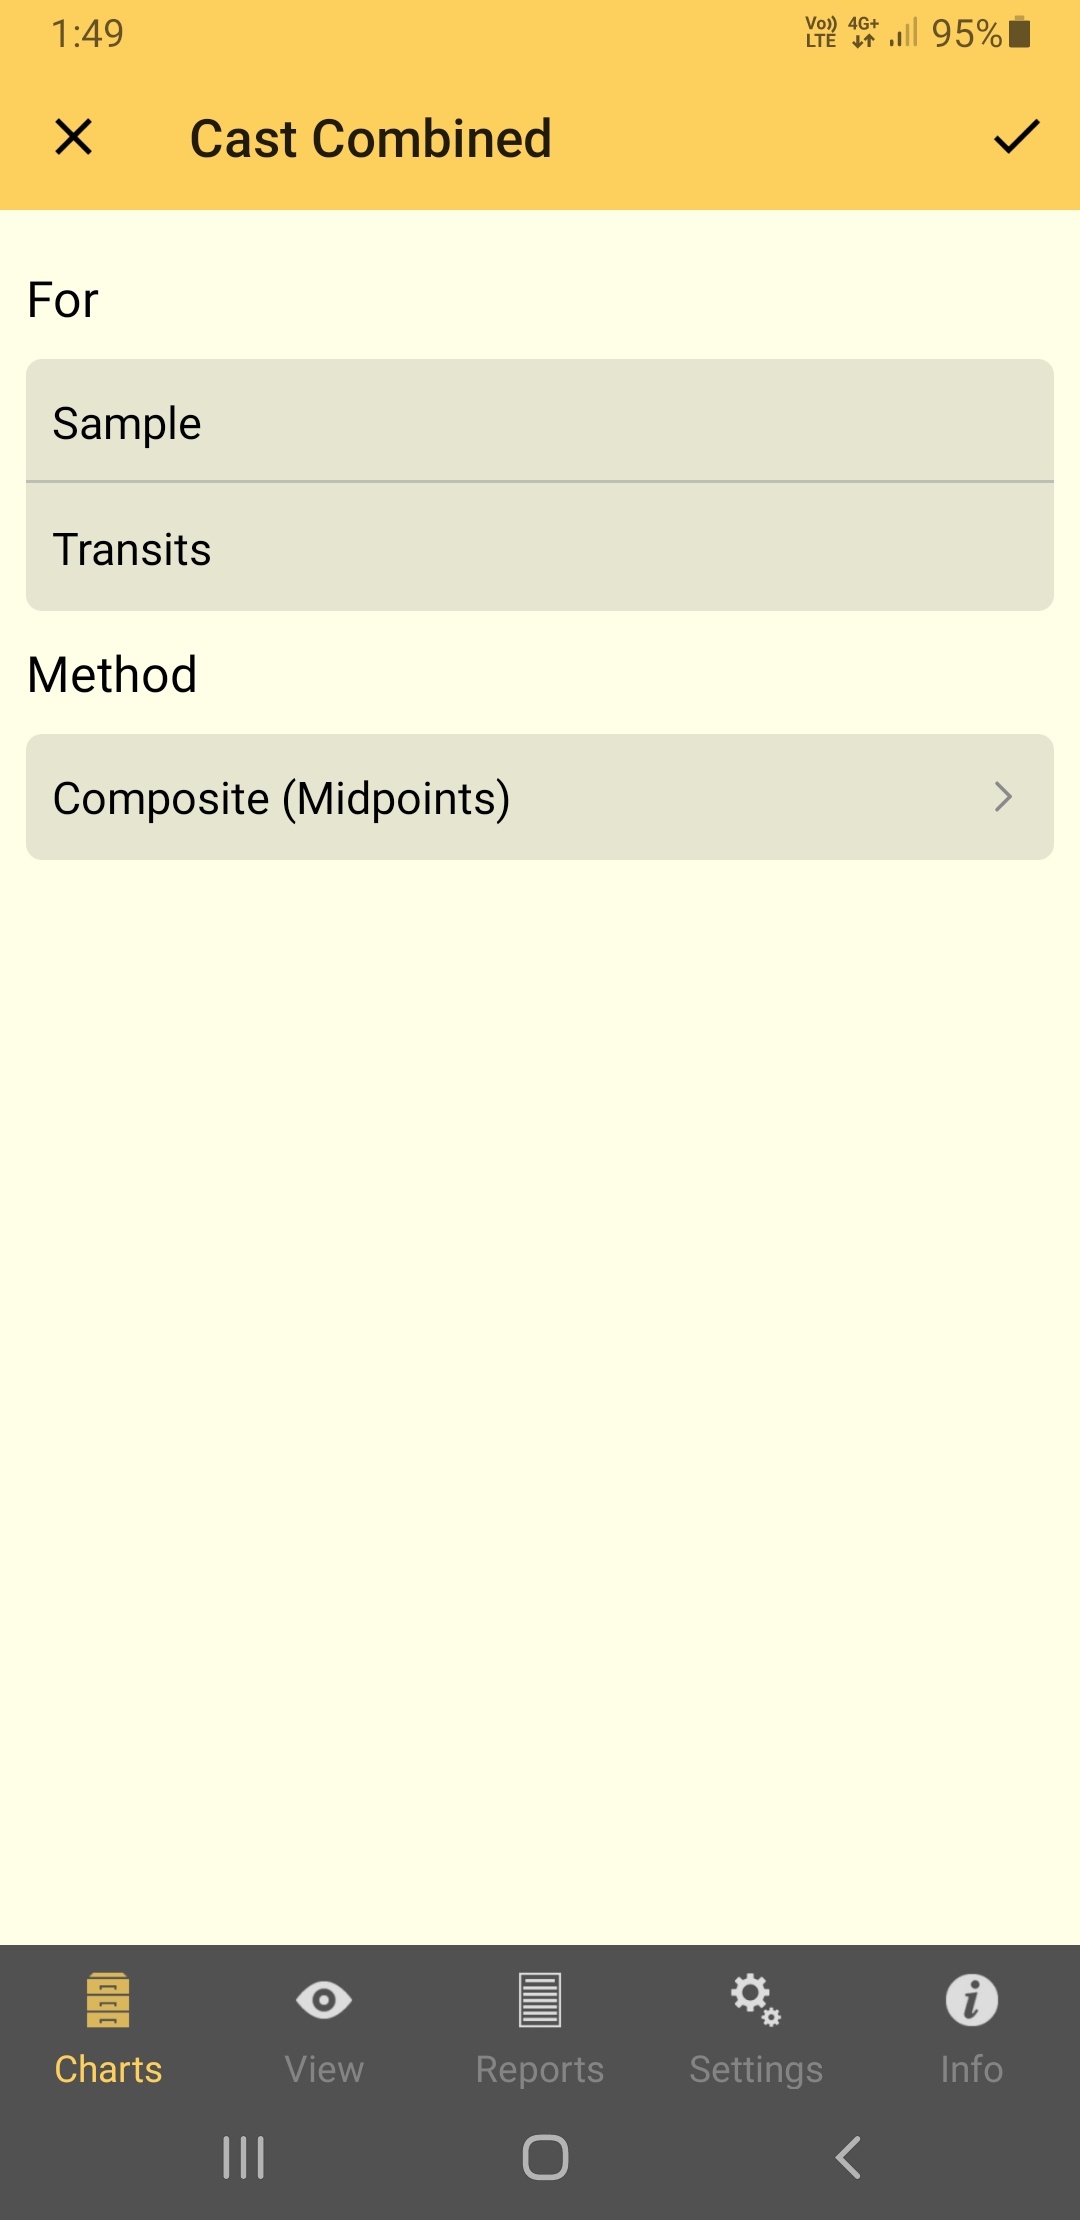 Combining two charts |
Two methods for combining charts are offered: the Composite method or the Relationship method.
NOTE: Combined charts are sometimes referred to as "composite" charts but as explained above this is simply one of the ways of creating a combined chart.
1)The currently selected "Method" is displayed, and you can change this by tapping on it. When you do you can then tap on either the Composite or Relationship method.
Composite (Midpoints)
This method uses the midpoint of the shortest arc joining each chart point, angle and house cusp within the two base charts. This then becomes the position of that point in the new chart.
When calculating any type of combined charts, Astro Gold first determines the composite longitudes, and then determines the composite right ascensions separately. Thus any right ascensions for a composite chart in Astro Gold are true composite right ascensions rather than right ascensions of composite longitudes.
Relationship (Davison)
This method calculates a new chart as if it was a natal chart for the midpoint in time, latitude and longitude of the two base charts.
2)Once you have completed the above tap on the Go icon in the top right corner of the "Cast Combined" pane to cast the combined chart, and be returned to the "Selected Charts" pane.
3)Or, to cancel combining the charts, tap on the Cancel icon in the top left corner of the "Cast Combined" pane.
In the "Chart Options" pane for "Chart 1", "Chart 2", or "Chart 3" tapping on Select From File opens the "Files" pane, where the available chart files are displayed. (Or if you have previously selected a chart from a chart file it may automatically open that chart file for you.)
(To return to the "Chart Options" pane for the chart without selecting a chart from a file, tap on Return Arrow in the top left corner of the pane).
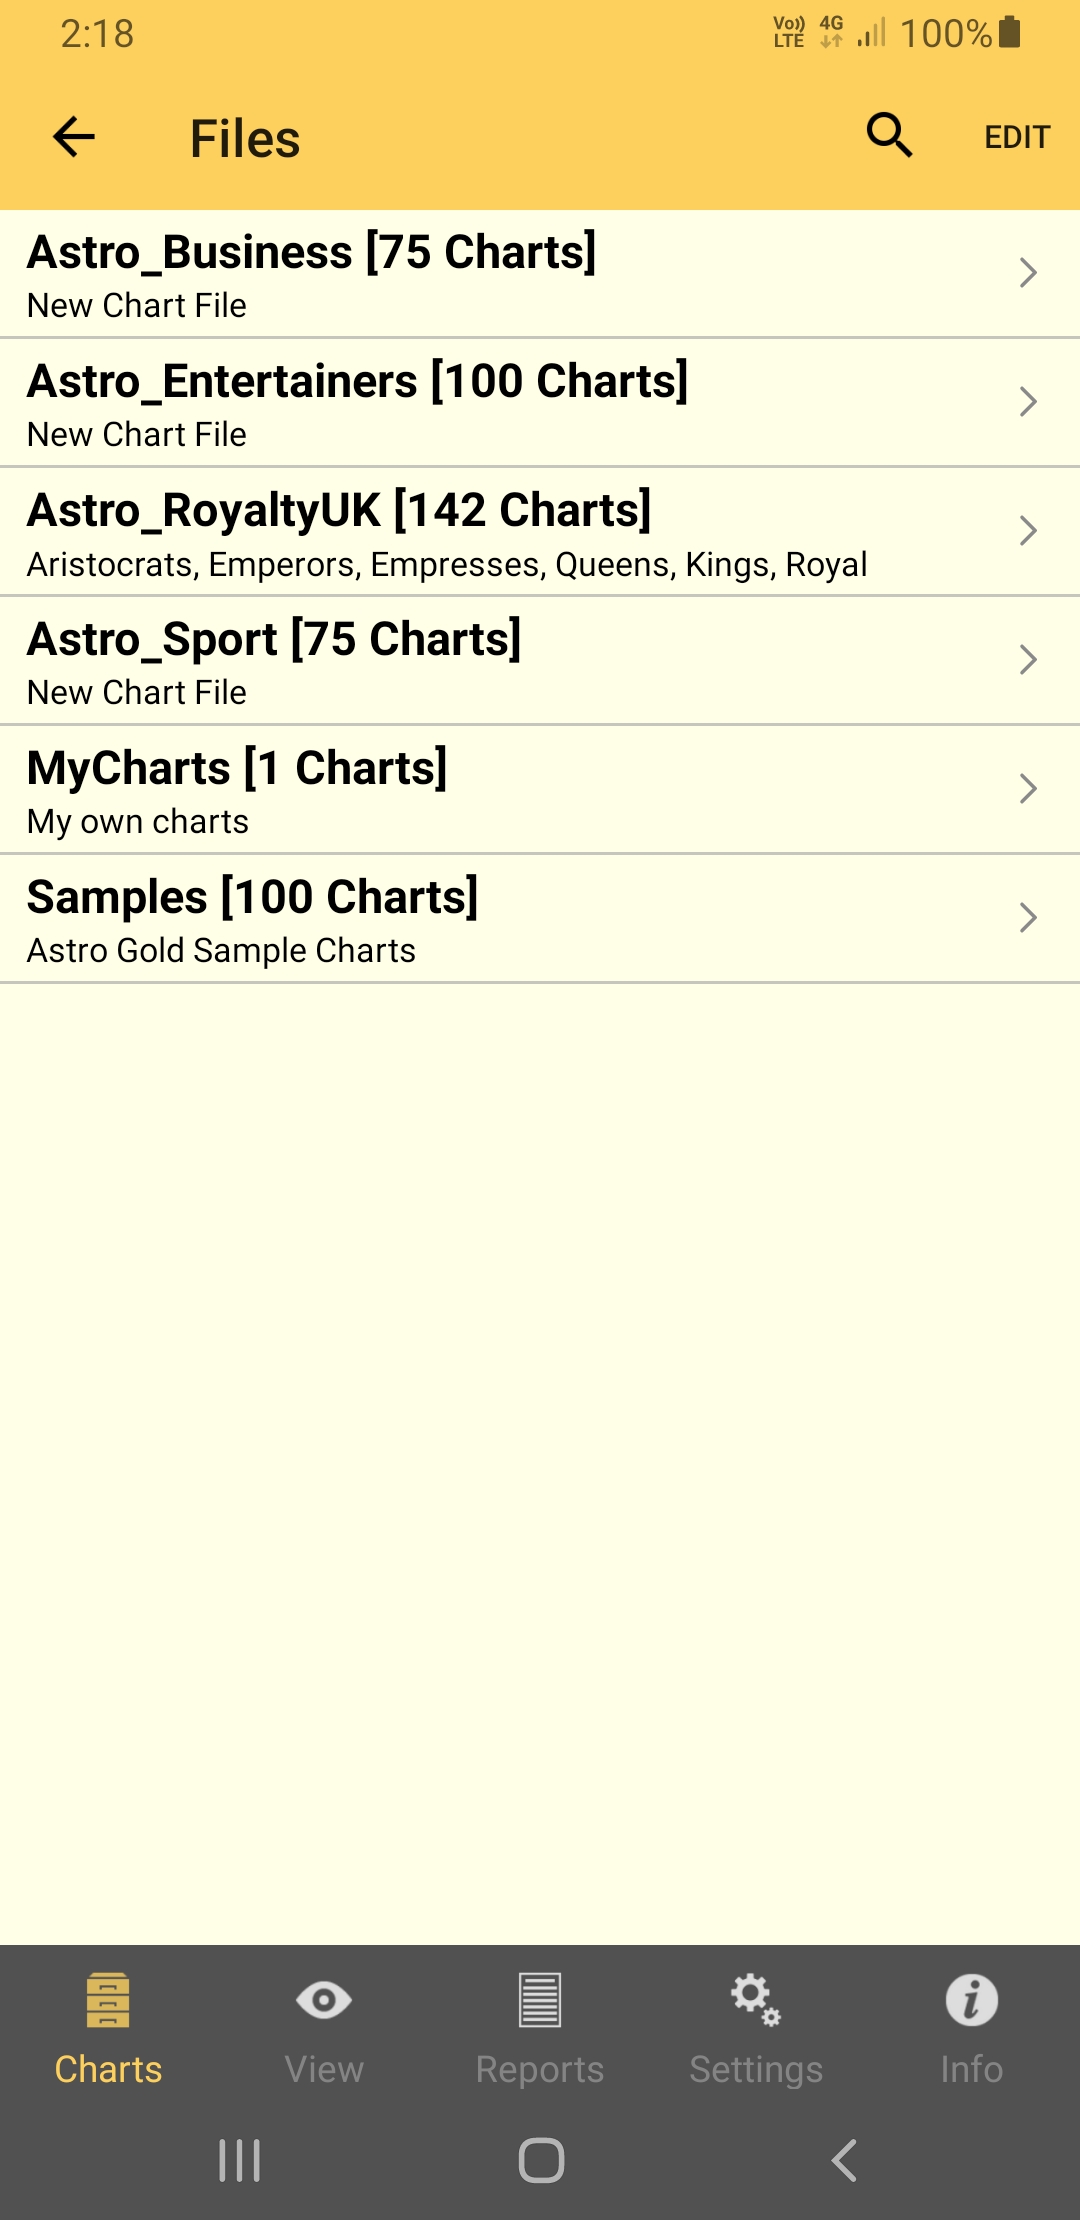 Files pane |
>> To directly search for a chart
1)To search for the chart you want tap on the Search  icon in the TOOL Bar, which displays a search text box in the TOOL Bar.
2)Type a few characters in the search text box. As you do all charts containing that character string will be listed under the chart file they are stored in. If necessary, scroll up and down to view the entire list.
3)Tap on the chart you want. This selects the chart and returns you to the "Selected Charts" pane.
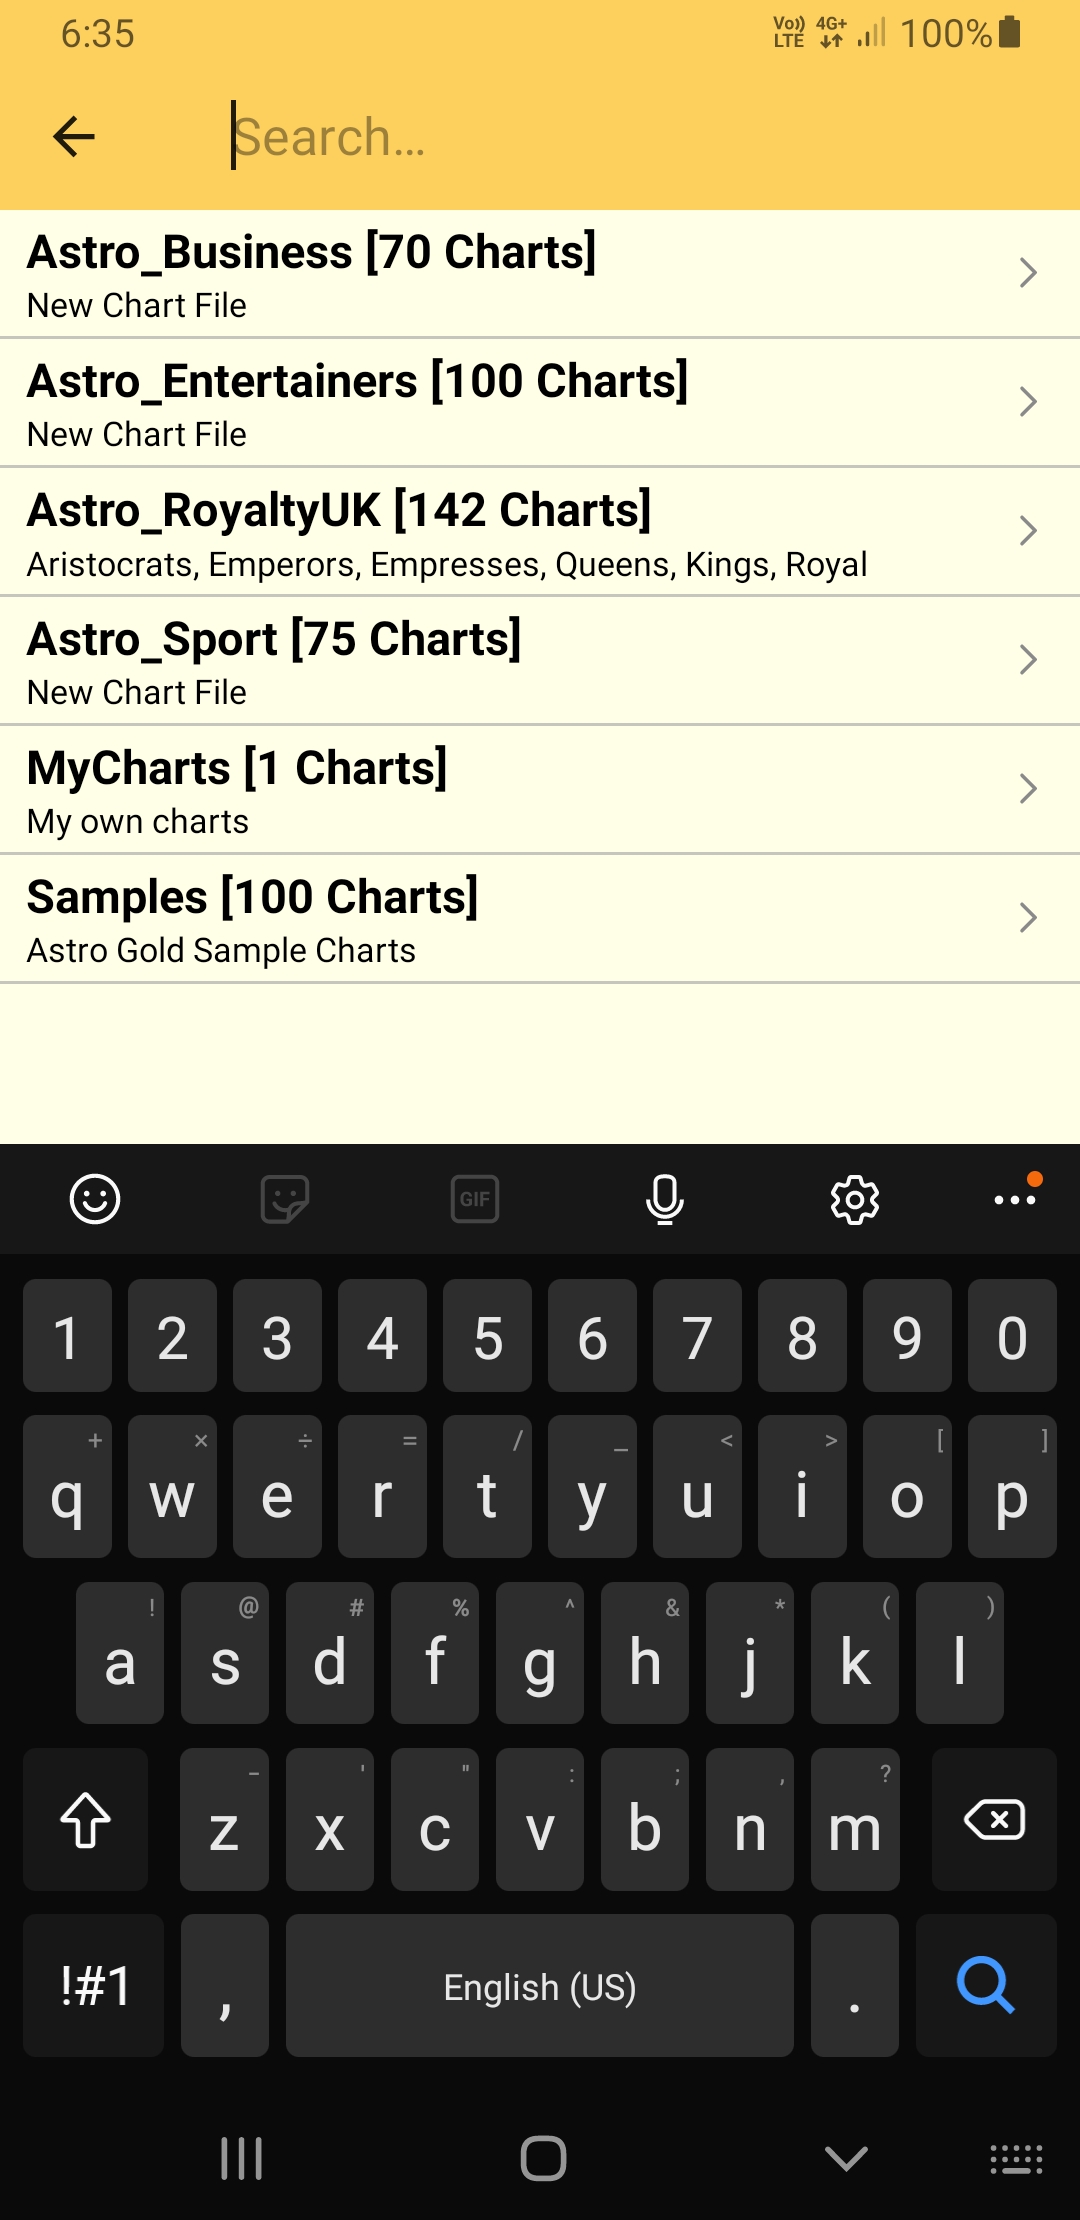 Searching for a chart |
1)in the "Files" pane ... tap on the chart file that contains the chart you want. This opens the "Charts" pane.
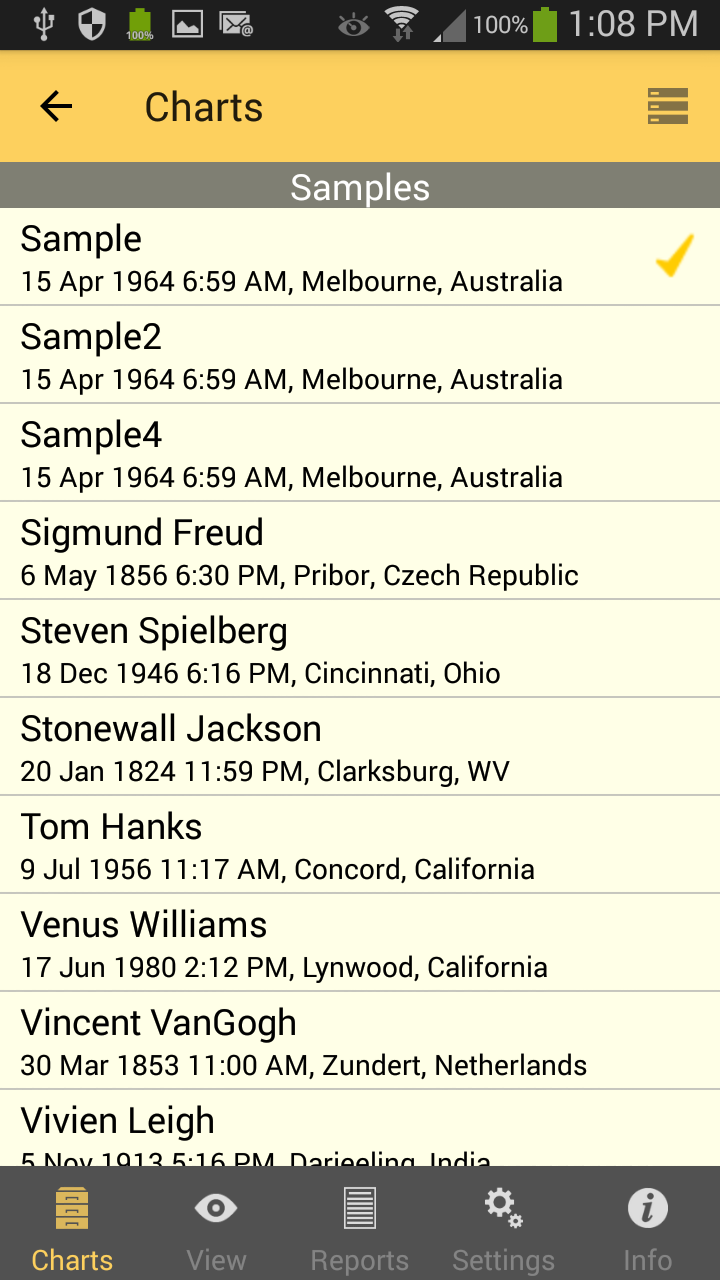 Charts pane |
>> To sort the charts
1)In the Charts pane tap on the Action button  in the top right corner. A small menu will pop up where you can select the way you would like the charts sorted.
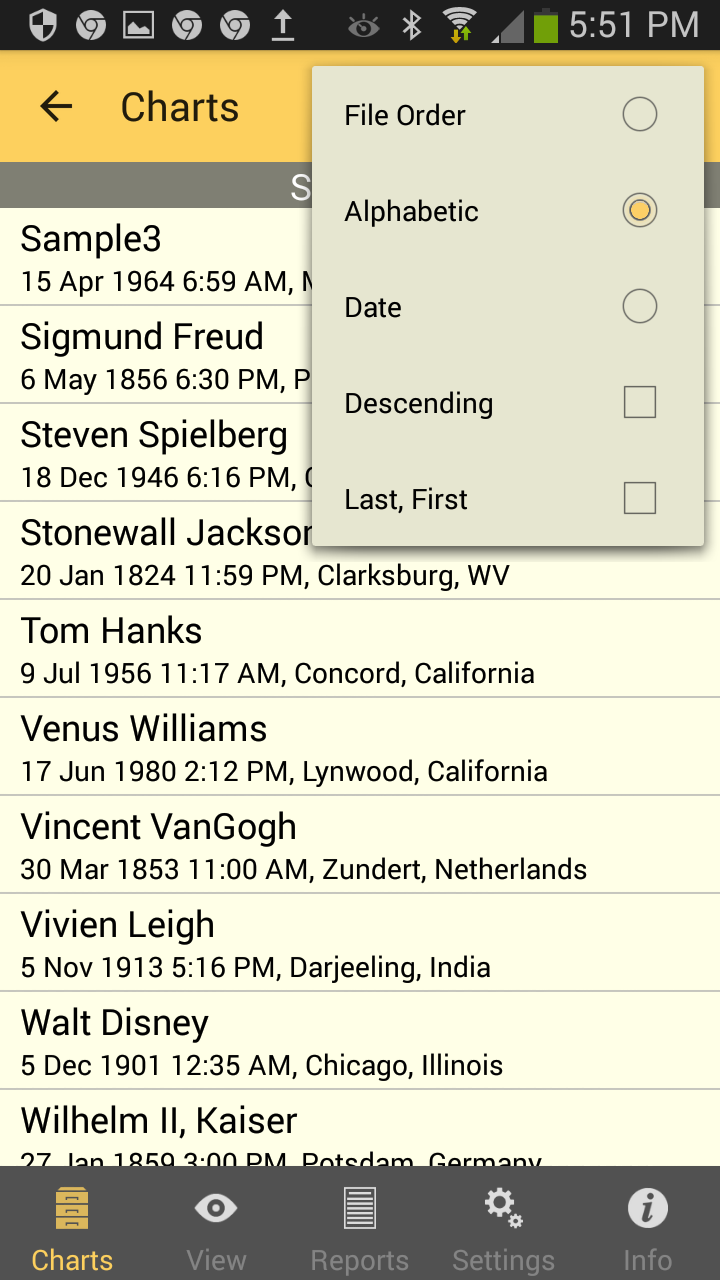 Chart sorting |
>> To Select a chart
1)In the "Charts" pane ... tap on the chart you want. This selects the chart and returns you to the "Selected Charts" pane.
>> To Create, Edit or Delete a Chart File
This section is about creating, editing or deleting an entire Chart File (potentially containing many charts). This is not the same as simply deleting individual charts from within a Chart File.
1) Tap on Charts tab in the TAB Bar.
2) Tap in the Chart Details area of any selected chart to open the "Chart Options" pane".
3) Tapping on Select From File opens the "Files" pane.
4) In the "Files" pane...tap on the Edit button in the top right corner. This puts the pane in edit mode.
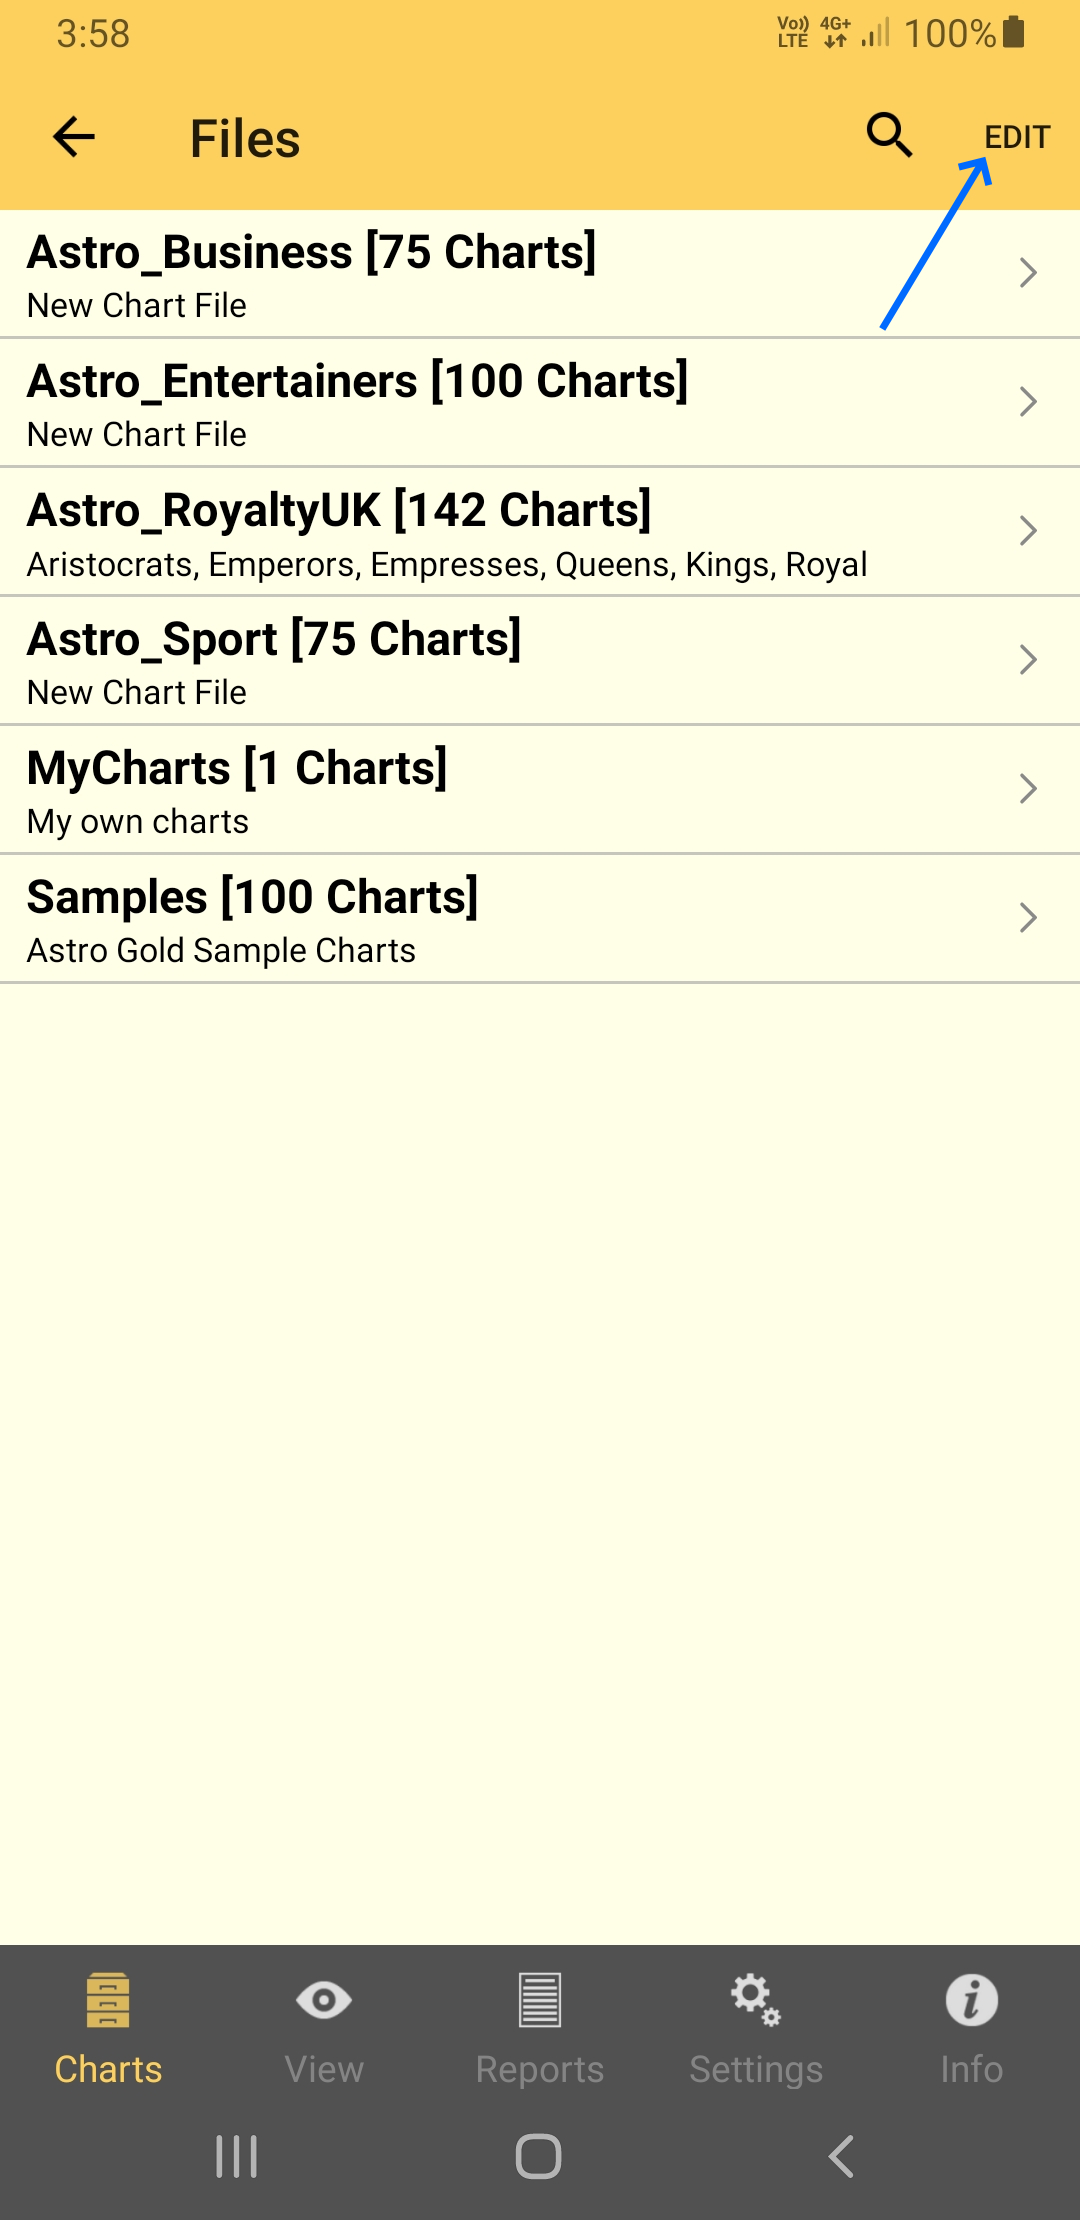 Chart Files |
(To exit out of edit mode before making any changes tap the Return Arrow in the top left corner of the pane, which will take you back to the "Chart Options" pane for the chart).
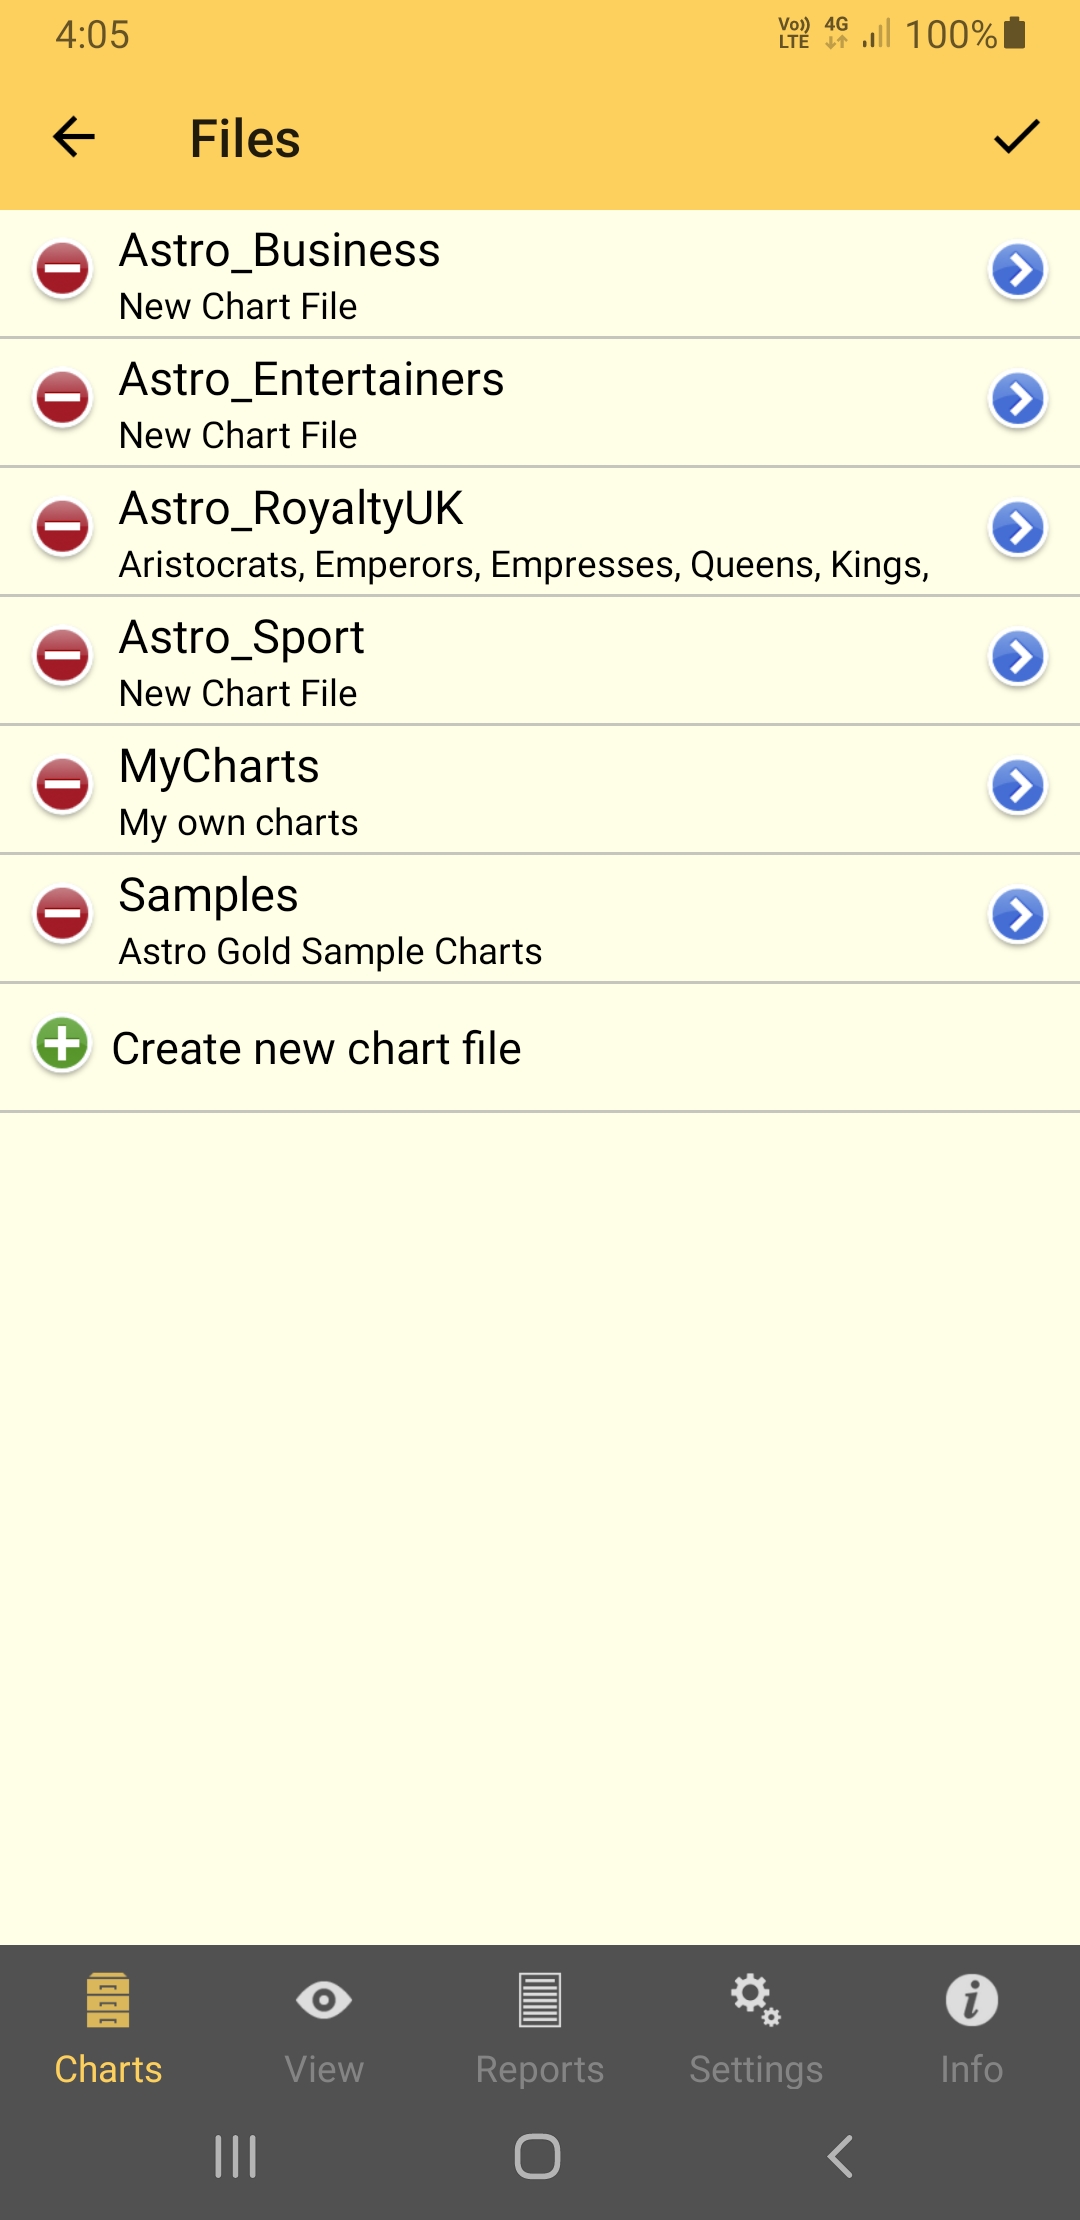 Chart Files in edit mode |
➢ To Create a new chart file:
a)Tap the  icon. This brings up the "File Details" window.
b)By tapping in each of the text boxes you can type in a file name and description respectively using the keyboard.
c)To save the new chart file tap on the Save button in the top right corner of the window.
d)To cancel creating a new chart file tap on the Return Arrow in the top left corner of the window.
➢ To Edit an existing chart file:
a)Tap the  icon. This brings up the "File Details" window.
b)By tapping in each of the text boxes you can then edit the file name and description respectively using the keyboard.
c)To save your changes tap on the Save button in the top right corner of the window.
d)To cancel your changes tap on the Return Arrow in the top left corner of the window.
➢ To Delete an existing chart file:
a)Tap the icon. This pops up a dialog box asking if you are sure you want to delete the chart file.
b)Tap on the Delete button.
c)If you have changed your mind you can tap on the Cancel button instead.
➢ When you are finished with the editing options above, to exit from Edit mode to the normal Selection mode, tap on the Go icon in the top right corner of the "Files" pane.
The "Chart Options" pane conveniently displays in a list all the charts you've used recently. To use any of these charts all you need to do is tap on the chart, and it will be selected and you will be returned to the "Selected Charts" pane.
There is no option to clear the Recently Used list or individual charts in it.