To display charts or chart information you must use (tap on) the Charts tab, which is located in the TAB Bar (at the bottom of the screen).
The Charts tab initially opens the "Selected Charts" screen which allows you to select charts. Select one chart to view a single chart wheel or aspect grid, or two or three charts to see a biWheel, triWheel or Synastry aspect Grid.
>> To select one chart, two or three charts
➢ Tap the 1 Chart button to select one chart, the 2 Charts button to select two charts, or the 3 Charts button to select three charts.
The details for the chart or charts are displayed in panels in the "Selected Charts" screen (and later the chart or charts you select here will be displayed on the main Viewing Area of the screen - see Viewing Charts). The chart name is at the top of the details in large characters, and under that in smaller characters is the chart type ("Male", "Female", "Event". "Sec. Prog" etc).
If you have selected two charts the first selected chart is called "Chart 1" and is always the inner chart of a biWheel, and the across chart of a synastry grid. The second selected chart is called "Chart 2" and is always the outer chart of a biWheel, and the down chart of a synastry grid.
If you have selected three charts the first selected chart is called "Chart 1" and is always the inner chart of a biWheel, and the across chart of a synastry grid. The second selected chart is called "Chart 2" and is the middle chart of a triWheel, but does not appear in a synastry grid. The third selected chart is called "Chart 3" and is always the outer chart of a triWheel, and the down chart of a synastry grid.
The various options you have for selecting charts to go in the 1 Chart, 2 or 3 Charts panel are detailed in Chart Options.
|
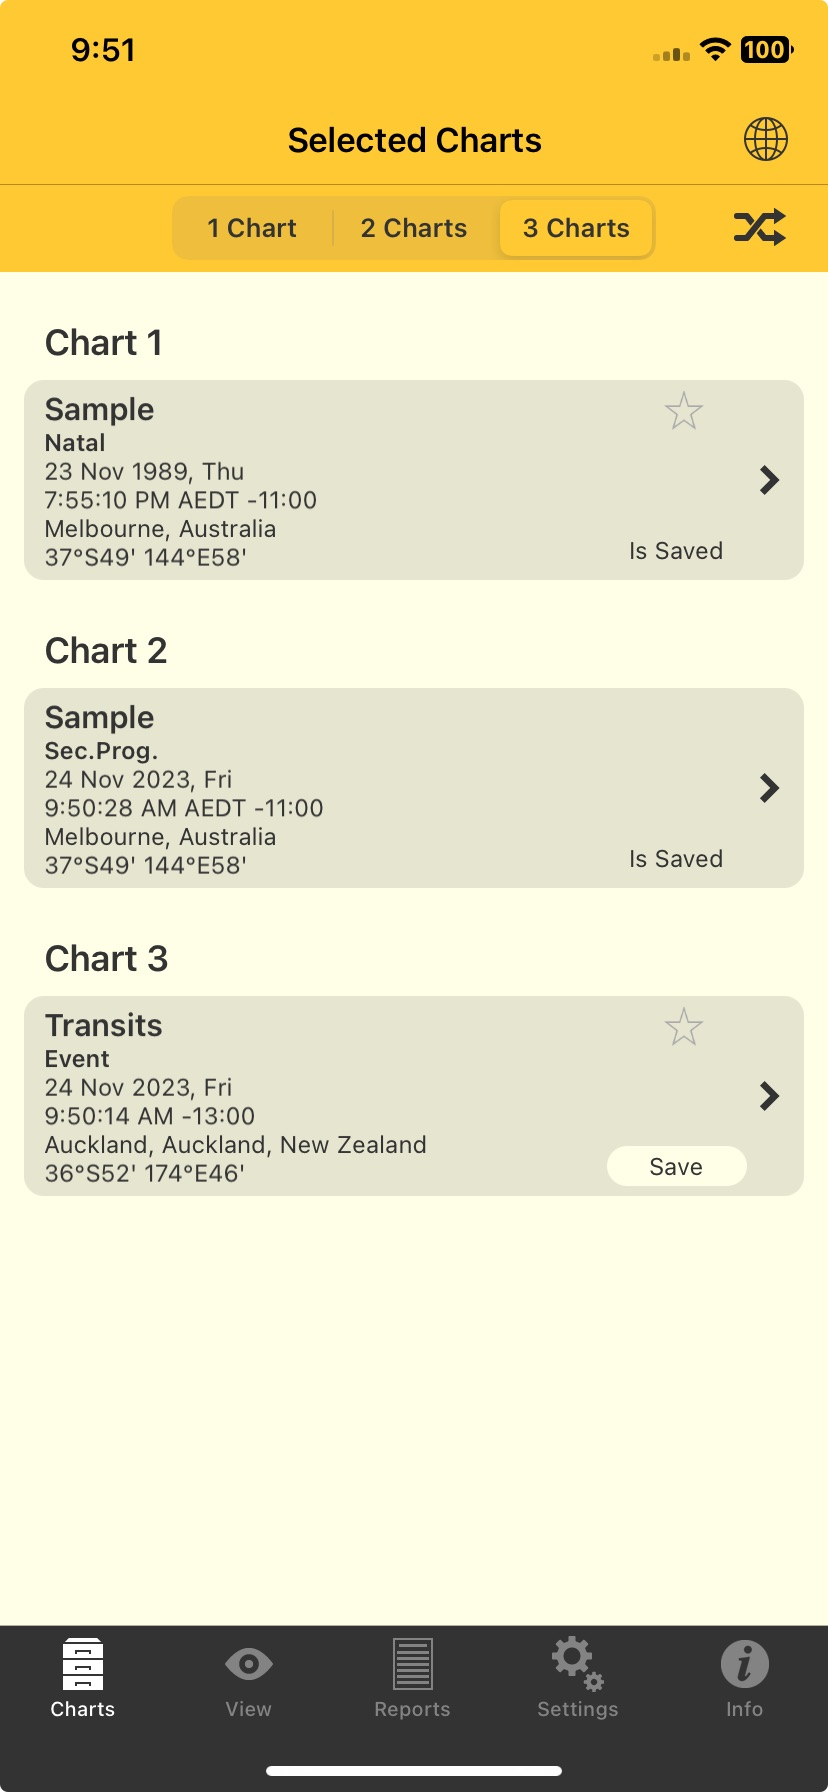 |
Selected Charts screen - with 3 charts selected |
>> To swap the position of each chart
➢ If you have two or three charts selected, tap the Swap/Delete icon  in the Toolbar to enter chart configuration mode.
|
 Chart Configuration Mode |
Selected Charts screen, chart configuration mode, - with 3 charts selected |
In chart configuration mode you can swap the position of any of the charts.
1)To do this press down on and hold down the swap icon to the right of the chart that you want to move into a new position.
This will cause the chart details panel (see Charts) for that chart to expand slightly into a well defined bordered rectangle that floats above the "Selected Charts" pane.
2)Still holding the swap icondown, at this point you are now able to drag the chart (details and all) up or down within the Selected Charts pane, as desired, into a different chart position.
As you do this the chart that was previously in the position you are moving into now vacates that position so the chart you are moving can be relocated there, with the displaced chart taking up whatever the other available position is.
3)Repeat this complete operation for every chart you want to reposition.
>> To remove a chart from the Selected Charts pane
1)Option 1: press down on the respective chart's details panel and slide it left, and a large rectangular "Delete" button  to appear to the right of the chart details panel. Tap this red Delete button and the chart will disappear. If before doing that however you change your mind and don't want to delete the chart after all then pressing down in the chart details panel swipe the chart right, or alternatively tap the Swap/Delete icon in the Toolbar to exit chart configuration mode.
2)Option 2: if you have three charts selected, tap the Swap/Delete icon in the Toolbar to enter chart configuration mode (see above).
3)Tap the Delete button  to the left of the chart you want to remove completely from the "Selected Charts" pane.
This will cause the chart details panel for that chart to shift to the left and a large red "Delete" button to appear to the right of the chart details panel. Tap this red Delete button and the chart will disappear. If before doing that however you change your mind and don't want to delete the chart after all then press down in the chart details panel and swipe the chart right, or alternatively tap the Swap/Delete icon in the Toolbar to exit chart configuration mode.
>> To save a chart
1.In the "Selected Charts" screen tap on the Save button (if it's displayed) in the chart details panel. This will bring up the "Save To File" screen where all the available chart files are displayed.
2.Tap on the chart file you want to save the chart to, which will select it (a tick will be displayed next to the file name).
3.Tap on the Save button in the Toolbar (top right of the screen) and you will be returned to the "Selected Charts" screen.
4.Alternatively, if you change your mind and don't want to save the chart, tap on the Cancel button in the Toolbar (top left of the screen).
>> To close the Selected Charts pane
➢ Tap on any of the other tabs in the TAB Bar.