Dynamic Listings are reports of dynamic events (e.g. transits, progressions etc.) occurring for a radix chart over a period of time. You can access Dynamic Listings from the View Menu, or via the Dynamic icon on the Toolbar (if you need it Screen Areas shows where the Toolbar is).
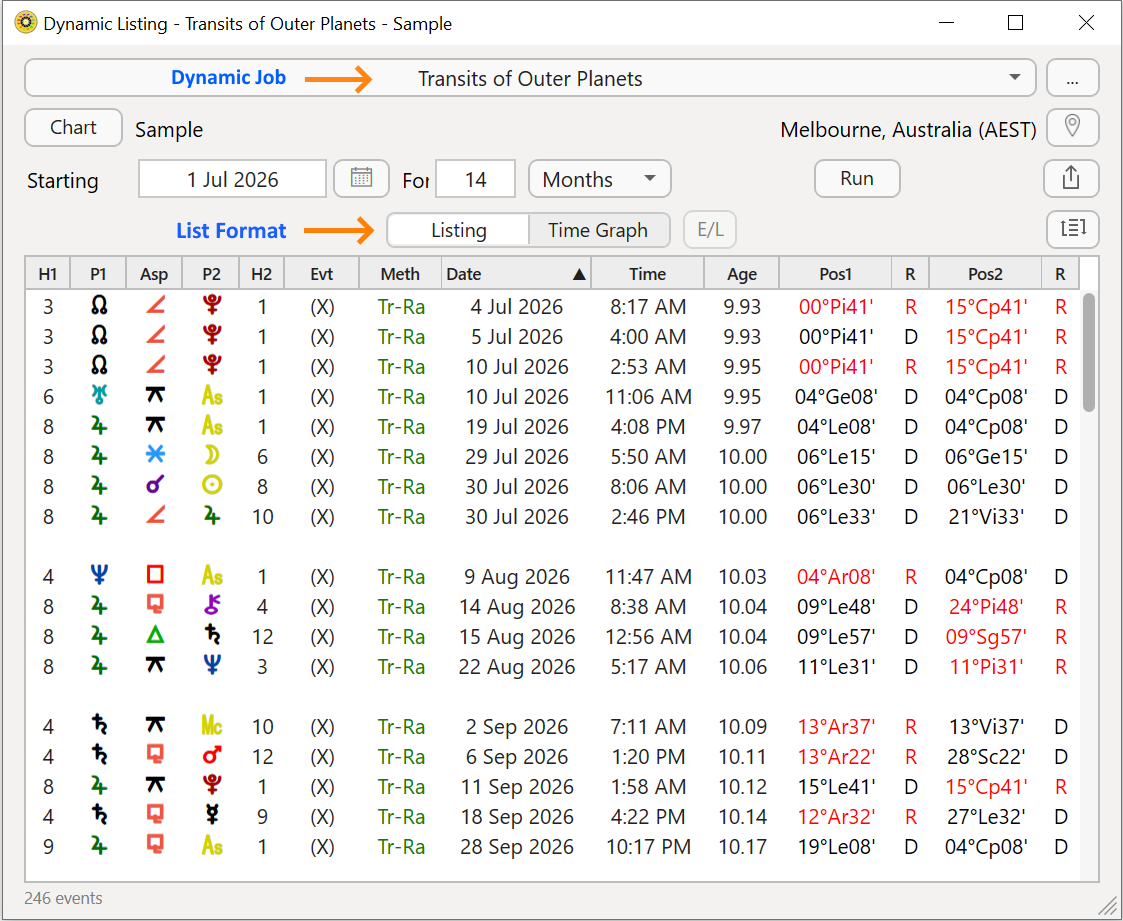
An example of a Dynamic Listing is shown below. This is a listing for the radix chart called "Sample". Radix means the birth (or original) positions for a natal (or event) chart.
 |
Astro Gold ships with twelve kinds of Dynamic Jobs.
A Dynamic Job contains all the instructions, settings and parameters for what dynamic events to generate in a Dynamic Listing:
•Transits of Outer Planets
•Transits of Inner Planets
•Lunar Transits
•Transits/Progressions 1 Yr
•Transits/Progressions/Directions 1 Yr
•Secondary Progressions 1 Yr
•Solar Arc Directions 1 Yr
•Van Dam Primary Directions 1 Yr
•Major Lifetime Transits
•Mundane Transits of Outers 1 Yr
•Transiting Lunar Phases 1 Yr
•Progressed Lunar Phases (Lifetime)
However you can create your own Dynamic Jobs as well, see Preferences - Dynamic Listings.
These Dynamic Listings are only ever for the chart selected in the Dynamic Listing window, independently of, and regardless of whether one or more charts (Chart1, Chart2 etc) are selected in the main app window.
Once the report is generated Dynamic Listings can be viewed in one of two display formats.
a)Standard Listing format
Just referred to as "Listing", this is the default format (shown above). It lists each event down the page, with the data (e.g. event date and planetary positions) for each event in columns extending across the page.
The number of events generated is determined by the Entering/Leaving setting.
To see the report in this format click on the Listing button  under the calendar icon.
b)Time Graph format
Each event is also listed down the page, and the data is also listed in columns. However a group of the column headings are actually points in the calendar over the time period used, and the peak (and optionally also duration) of each event is displayed in these columns, forming a plotted calendar of events. This allows you to see at a glance the timing of all events as a whole. The number of events generated is always the same.
To see the report in this format click on the Time Graph button  next to the Listing button.
With either format, by default blank section divider lines are automatically added (with sections automatically determined from the current sort order e.g. sorting by planet creates a section for each planet, sorting by date creates a section for each day, calendar month, year or decade depending on the duration of the report.
You can however control whether section breaks - blank (divider) lines - are included or not via the Sort menu.
Multiple simultaneous Listings
>> To generate a Dynamic Listing
1.Clicking on the Dynamic icon  in the Toolbar (at the top of the screen), or in the View menu then selecting Dynamic Listings, displays a new "Dynamic Listing" window. Each time you do this it creates a new separate Dynamic Listing window (with its own independent settings).
2.Click in the dropdown box across the very top of the Dynamic Listing window to select the kind of Dynamic Job you want to use to generate the report with.
3.When a Dynamic Listing window is initially opened, whatever chart is currently selected as Chart 1 in the main app window will automatically be displayed to the right of the "Chart" button, which is directly underneath the "Dynamic Job" dropdown box. If you had more than one chart selected in the Astro Gold Main Screen, and you want the dynamic listing to be for one these other charts, then click the Chart button, and choose that other chart.
4.If you want to change the location for the dynamic events click on the Location icon near the top right of the window above the "Actions" icon. Once changed click the Apply button.
TIP: Regardless of what location is selected, if you want times for the listing to be in universal timezone (UT) simply check the UT checkbox in the bottom right hand corner.
5.Fill in the Starting date or click on the Calendar icon  just to the right of it and select a date. When you've done that click on the Calendar icon again to close the calendar.
TIP: You can click on "Now" or "Radix" above the selected date field ... to immediately select the current date, or the radix date - which is the date of chart (who the dynamic events are being generated for).
6.Set the duration of time for the listing - by clicking in the unit of time dropdown box to select between Days, Months or Years, and then entering the number of time units to use in the textbox labeled For to the left of that, to define the actual period to generate dynamic events for.
You can enter a date before 0 AD, i.e. a BC or BC date, from the calendar, or by putting a "–" sign before the year in the "Starting" textbox, to indicate the number of years before 0 AD the Start date is. Remember that there is no actual year 0 in the BE/AD system. So -14 years (an astronomical expression) does not equate to the year 14 BC (a Julian Calendar expression), it equates to 15 BC.
7.Click the Run button. The report is generated.
List display format
When the display format is "Listing" the Dynamic list has the following columns ('radix' means the Base Chart, usually a natal or event chart) :
•House the Dynamic Point is in (H1)
•Dynamic Point (P1)
•Aspect (Asp)
•Radix Point (P2)
•House the Radix Point is in (H2)
•Event stage - entering E, exact X or leaving L (Evt). If the event has already entered within orb before the starting date it will written as E..
•Event Method e.g. transit to radix, secondary progressed to radix, solar arc to radix (Meth)
•Date
•Time
•Age - as at the event date/time, the lapsed time since the radix chart date/time
•Dynamic Point zodiac position (Pos1)
•Dynamic Point movement direction - retrograde or direct (R)
•Radix Point zodiac position (Pos2)
•Radix Point motion direction - retrograde or direct (R)

>> Showing more or less dynamic events in the list
Click on the Entering/Leaving icon (  ) to see when the event (e.g. the transit) enters into orb of exact aspect with the radix planet, and also leaves orb of exact aspect with the radix planet. It is greyed out when not switched on. When not switched on aspects of the dynamic point to the radix point (hits) are shown only if they are exact.
1)Clicking in any column header (except for the two motion direction columns) sorts the listing with that data in alternating ascending/descending order.
2)Clicking on the Sort icon in the Dynamic Listing screen enables you to select a sort option from a list that drops down - see below.
3)If you don't want the report divided into different sections with blank (divider) lines then make sure Omit Breaks is ticked.
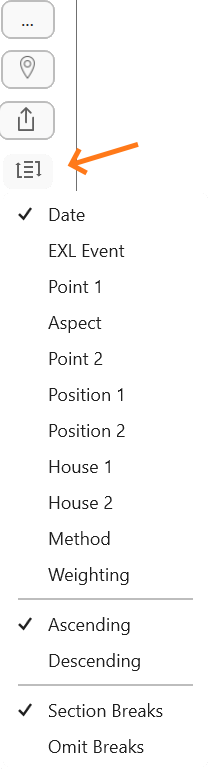 Dynamic Listing - sort icon and its dropdown list of sorting options |
>> To see an Interpretation for an event
Double-click on the event. A window pops up with the interpretation in it.
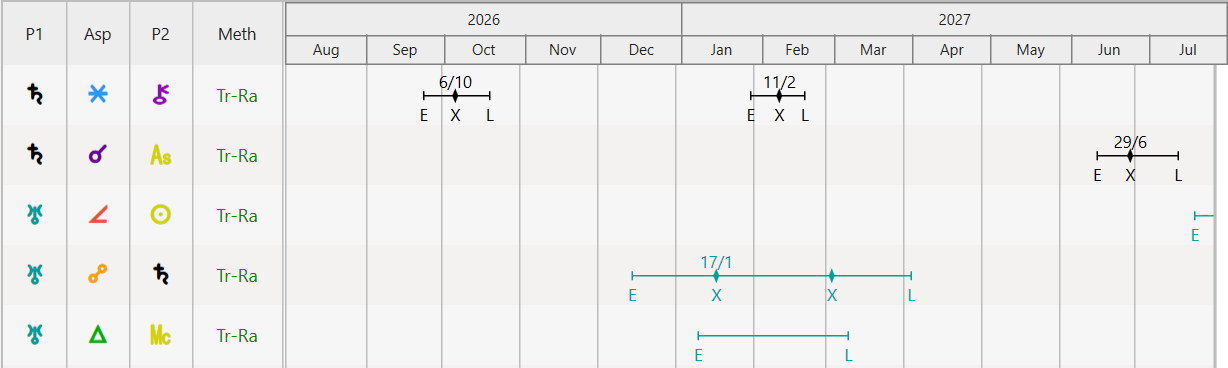
When the display format is "Time Graph" the report has the following columns ('radix' means the Base Chart, usually a natal or event chart) :
•Dynamic Point (P1)
•Aspect (Asp)
•Radix Point (P2)
•Event Method e.g. transit to radix, secondary progressed to radix, solar arc to radix (Metho)
•Calendar Point columns.
The Calendar Point column headers are either a series of contiguous days, months, quarters or years, or a mix of these, depending on how long the report period spans.
Each event, regardless of whether Entering/Leaving is on or off, is listed only once down the page, on the left. To the right of the event, if Entering/Leaving is on, the entering, exact and leaving moments are marked in the column where those occur, all connected by a line (example as below). If Entering/Leaving is off, only the exact event is marked in the column where it occurs. If there are several exact events occurring for an event within the report duration, these exact events are all connected with a line running through them (not shown).
>> Showing more or less dynamic events in the time graph
Click on the Entering/Leaving icon ( ) to see when the event (e.g. the transit) enters into orb of exact aspect with the radix planet, and also leaves orb of exact aspect with the radix planet. It is greyed out when not switched on. When not switched on aspects of the dynamic point to the radix point (hits) are shown only if they are exact.
>> Showing on dates on the TimeGraph
•Click on the Dates icon (  ) to see the date when the event (e.g. a transiting point aspecting a radix point) starts ("E" for enters into orb), becomes exact ("X"), and ends ("L" for leaves orb).
•An orb is the amount (in degrees, minutes and optionally seconds) of longitude, separately before and also after an exact aspect between two points, in which the aspect is considered "active". For example there can be 1° (in longitude) of orb before an aspect becomes exact i.e. meaning the aspect becomes active 1° before actually becoming exact (0°); and 1° (in longitude) of orb after an aspect becomes exact, meaning the aspect remains active 1° after actually becoming exact.
•The dates icon becomes greyed out when switched off.
•You can see at the bottom of the screen the date an event starts or ends by hovering the mouse crosshair cursor over the "E" or "L" of the event span icon (E--X--L).
•When the Dates icon is switched off you can still see when events happen using the same method - by hovering the mouse crosshair cursor anywhere over the Time Graph, and as you do so it displays the date for the position where the cursor is, at the bottom of the screen.
>> Ways to sort the report
•Clicking on the Sort icon  in the Dynamic Listing screen enables you to select a sort option from a list that drops down.
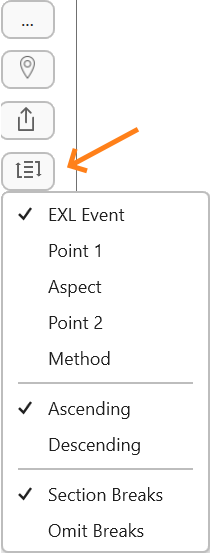 Dynamic Time Graph- sort icon and its dropdown list of sorting options |
>> Resizing the TimeGraph window
•Hover the mouse over the edge of the window until it turns into a single or double-pointed arrow. Then holding the mouse button down drag the window edge to the position where you want it to be, then release the mouse button.
>> To print the list, export the list as a PDF file, or send it to a Calendar
1) Click on the Share button  to the right of the "Run" button. It will dropdown the following menu. if you choose Print, it will print in landscape.
|
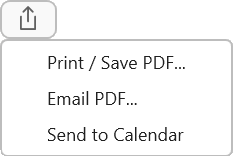
2) To send to a Calendar see Calendar Export for more info.