Tapping the Reports tab in the TAB Bar opens the "Reports" pane.
 |
Report items for charts consist of:
•Beginners and Legends
•Basic Details
•Aspect Listings
•Essential Dignities
•Midpoint Sort
•Lunar Events
•Dynamic Listing
•Interpretations
Interpretations are available in a variety of types to suit different types of charts:
•Natal
•Synastry relationship
•Solar return
•Lunar Return
•Progressed
•Transits
What interpretation types will be available differs depending on what type of chart is selected (natal, transits, subsidiary etc.).
>> When the single chart selected is ... the report type available is:
•Natal chart: natal chart interpretations
•Current Transits - Here and Now chart: interpretations for the current mundane chart (at the Home location)
•Secondary Progressed chart: progressed chart interpretations
•Tertiary or Minor Progressed chart: natal chart interpretations
•Any Directed chart: natal chart interpretations
•Any Profected or a Primary van Dam chart: natal chart interpretations
•Solar Return: solar return chart interpretations
•Lunar Return: lunar return chart interpretations
•Combined chart: natal chart interpretations
>> When the two charts selected are ... the report type available is:
•Two Natal charts: synastry relationship interpretations
•Natal, and Any Progression charts: progressed to natal interpretations
•Natal, and Any Directed charts: progressed to natal interpretations
•Natal, and Any Return charts: synastry relationship interpretations
•Natal, and Current Transits charts: transits to natal interpretations
>> When the three charts selected are ... the report type available is:
The same as when two chart are selected, except Chart 1 and Chart 3 are used as the two selected charts, with the following exceptions:
•Natal, Secondary Progressed, and Transits charts: progressed to natal chart interpretations for Chart 2 to Chart 1
•Natal, Transits, and Any Progressed charts: transits to natal chart interpretations for Chart 2 to Chart 1
•Natal, Any Return, and Any Progressed charts: interpretations for the synastry relationship between Chart 2 to Chart 1
Once you have selected one, two or three charts you then select the report item you want. This same report item will then be the one displayed for every selected chart or combination of selected charts until you change it.
In summary, what content is initially displayed depends on the type of chart(s) selected, and the kind of report item currently selected. The screen will either display a report for whatever chart or charts have been selected, or present you with the items (or sections) of the report to choose from, or options you can set for the report before generating the report.
>> To select the type of Report Item
1.Select one, two or three charts.
2.Tap on the Reports Tab in the TAB Bar.
3.Tap the Menu icon  in the TOOL Bar (top right of the screen). This will display a menu of the eight report items (Beginners and Legends, Basic Details, Aspect Listings, Essential Dignities, Midpoint Sort, Lunar Events, Dynamic Listing, Interpretations).
4.The currently selected report item will have its radio button filled in. To change that tap on the report item you want, which will select it. This will change the "Reports" pane to display that report item for the selected chart(s) and return you to the Report. Whatever report item is displayed you can swipe vertically up and down to scroll all the items in the Report or Listing.
Basic Details
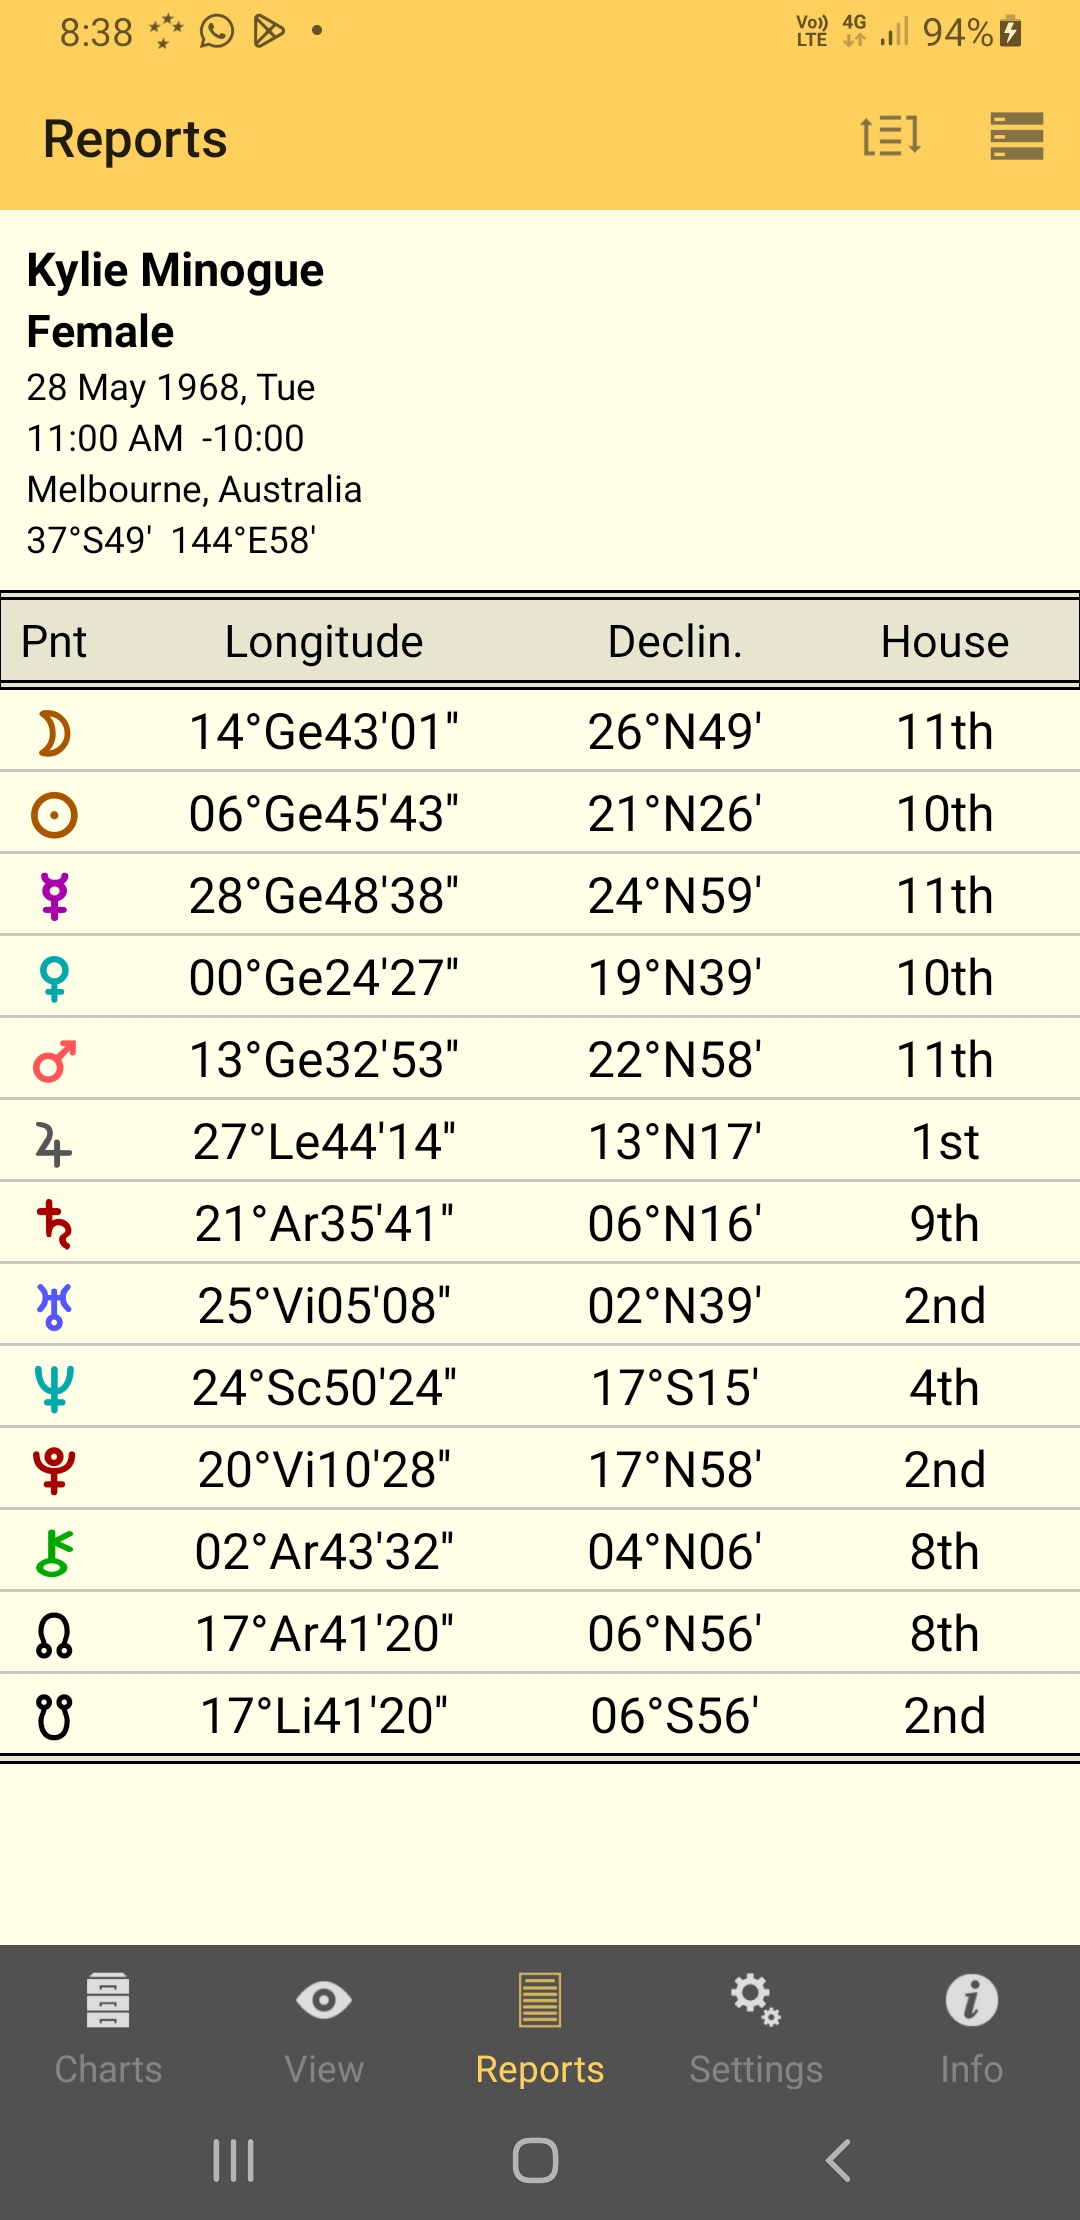
Here is a Basic Details Report showing basic chart details. If more than one chart is selected they will all be shown, one after the other.
|
Sorting
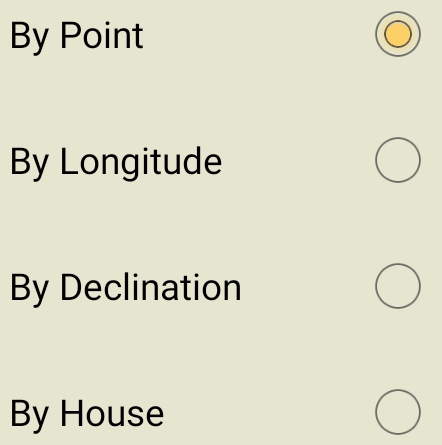
To sort the list tap on the Sort  icon in the TOOL Bar, next to the "Menu" icon. Then tap on the sort option you want.
|
Aspects Listings
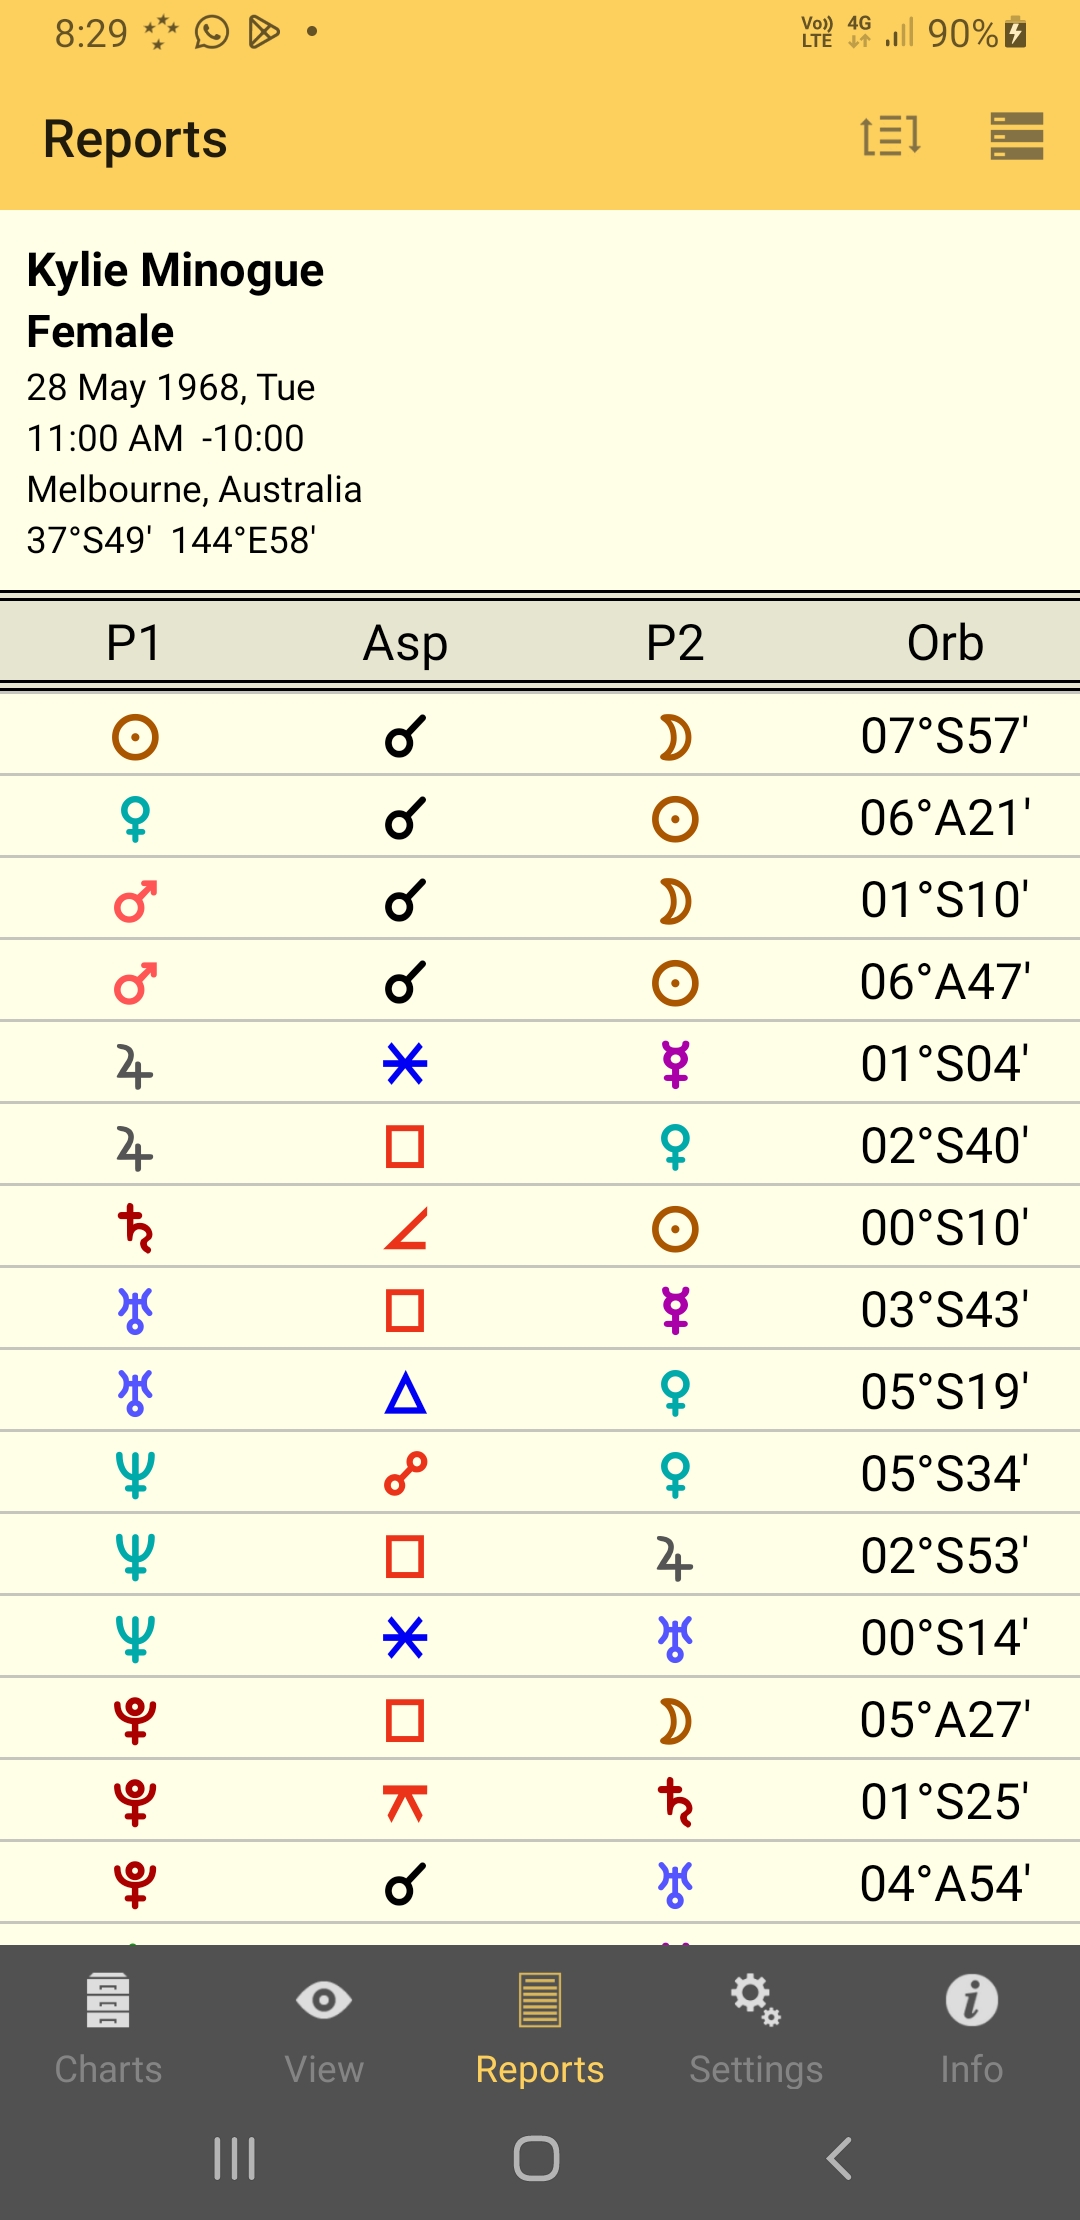
Here is an Aspects Listing showing aspects for a chart. If more than one chart is selected it will be synastry aspects from Chart 2 to Chart 1.
|
Sorting
To sort the list tap on the Sort icon in the TOOL Bar, next to the "Menu" icon. Then tap on the sort option you want.
|
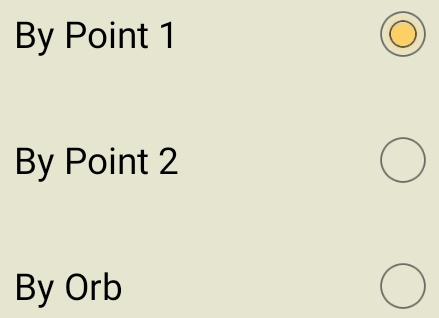
a)By Point 1 - all of Chart 1's points are grouped together
b)By Point 2 - all of Chart 2's points are grouped together
c)By Orb - aspects are grouped together by smallest to largest orb
"By Point 1" means that all of the aspects from each of Chart 1's Displayed Points will be listed together in groups of one Displayed point at a time.
|
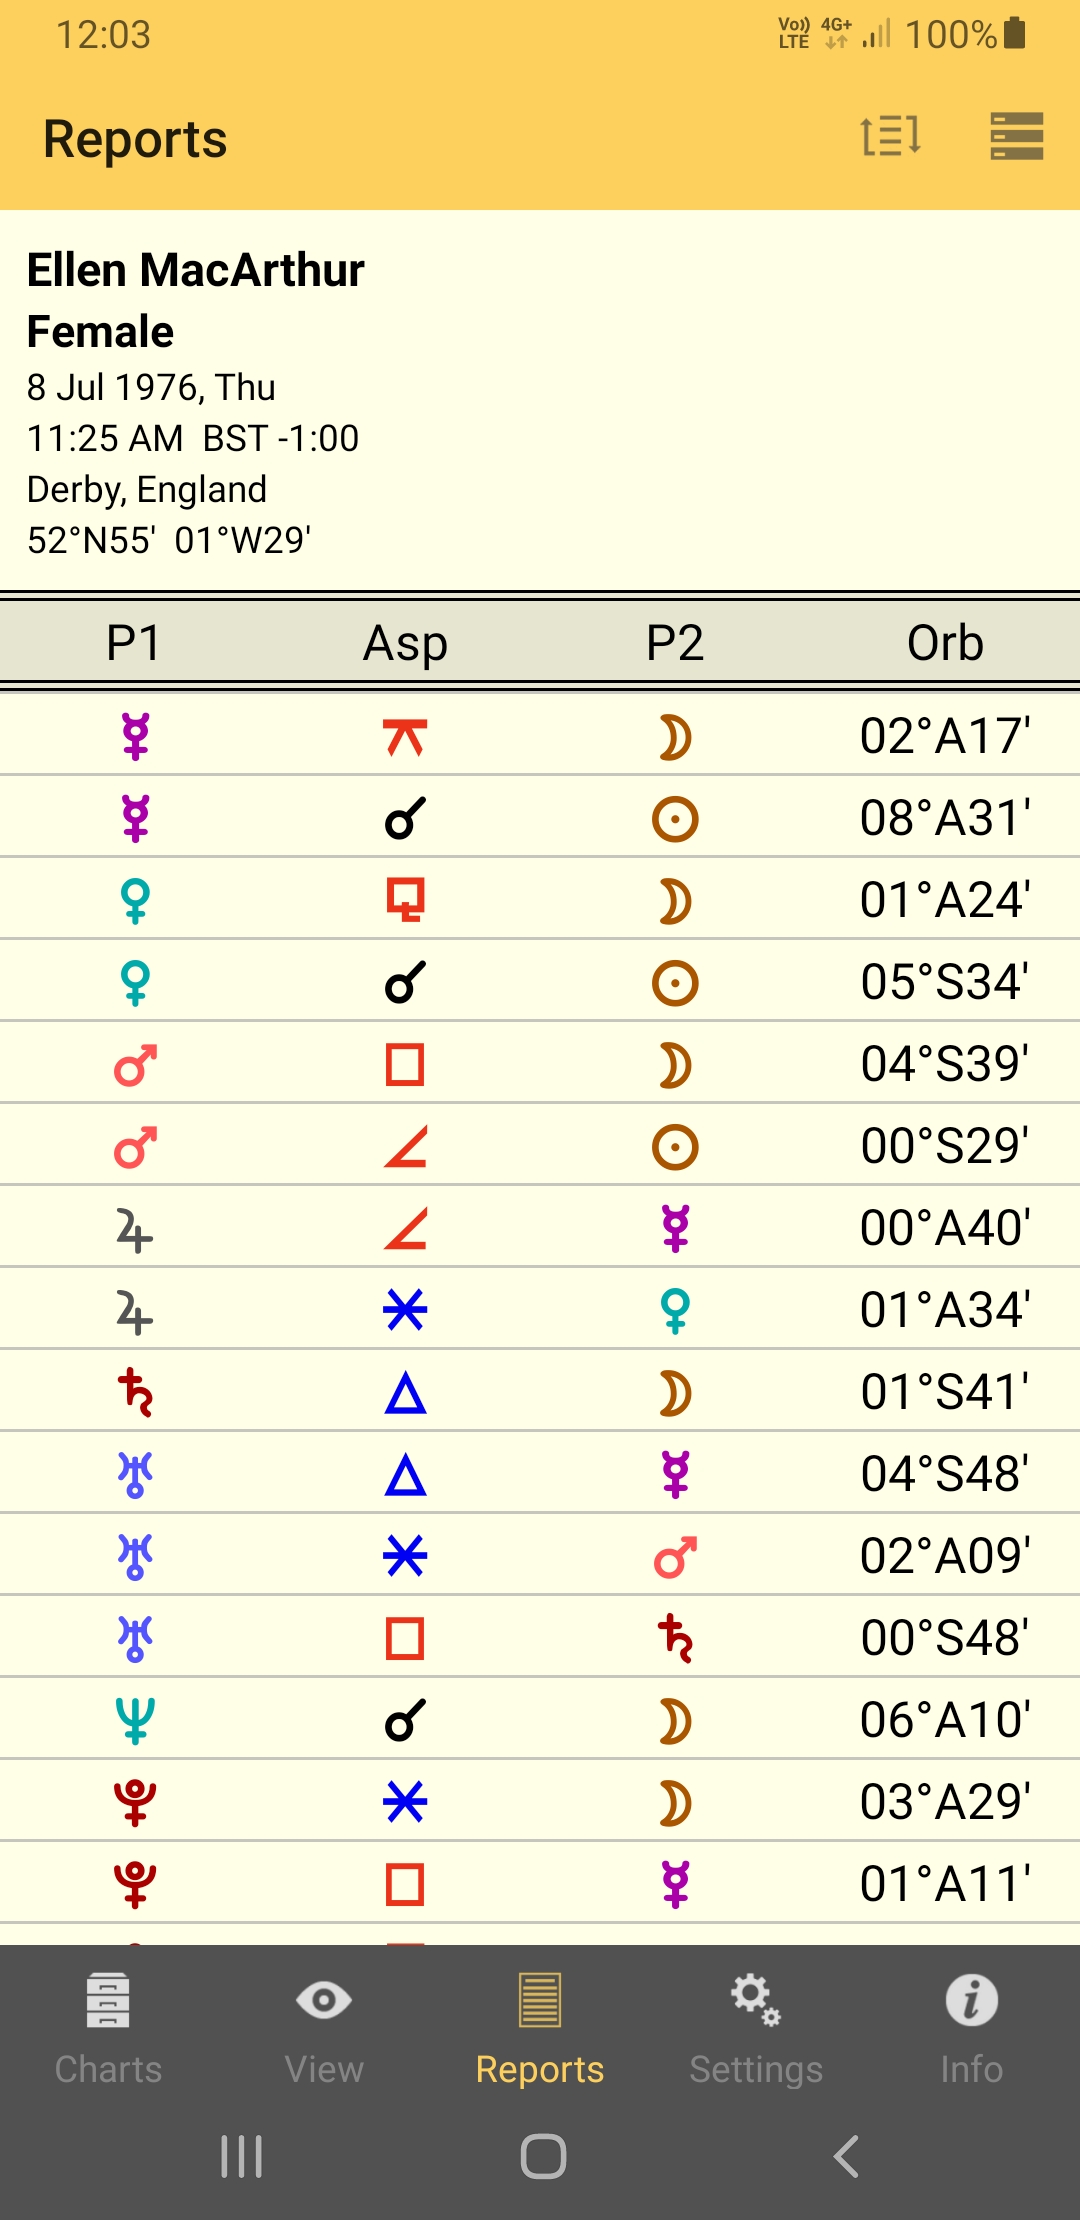
In the graphic above, where a single chart is selected, we can see all of Mercury's aspects, then Venus's aspects, then Mars's aspects etc, etc.
|
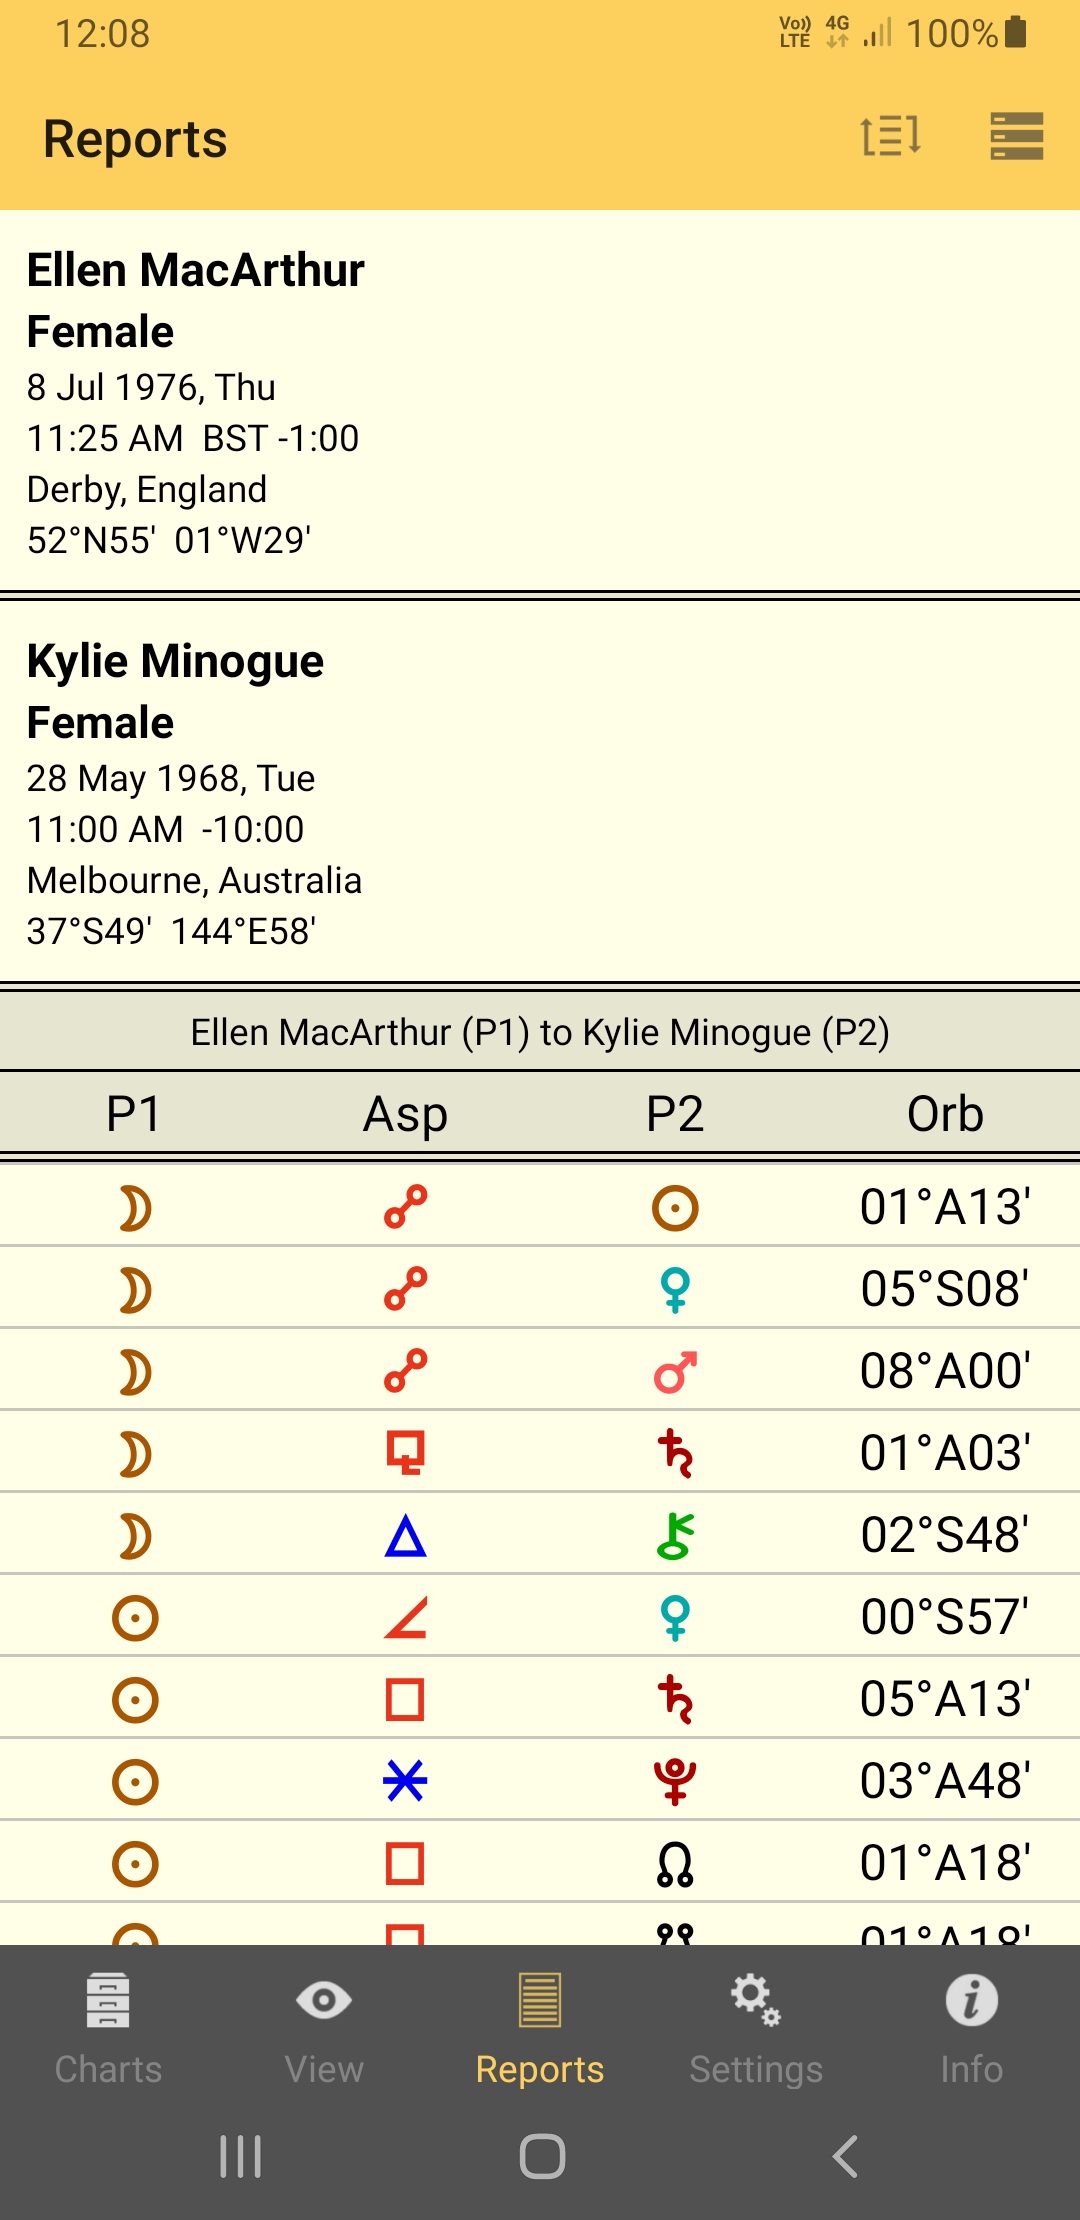
Whereas when two charts are selected and thus the listing includes synastry aspects, Chart 2's (Ellen MacArthur's) displayed points are in the P1 column and Chart 1's (Kylie Minogue's) displayed points are in the P2 column.
In the graphic above we can first see all of the aspects that Chart 2's Moon makes with various Displayed Points in Chart 1. Next we see all of the aspects that Chart 2's Sun makes with various Displayed Points in Chart 1, and so on.
With the "By Point 2" option the situation is simply reversed. Therefore in the example above you would see all of Chart 1's points (in the P2 column) grouped together, starting with showing all of Chart 1's Moon aspects to various points in Chart 2 (in the P1 column).
"By Orb" sorts all the aspects between Chart 1's points and Chart 2's points based on the orb of the aspect, starting with aspects that are exact, then those that have the smallest orb and on to those with increasingly bigger orbs.
Essential Dignities
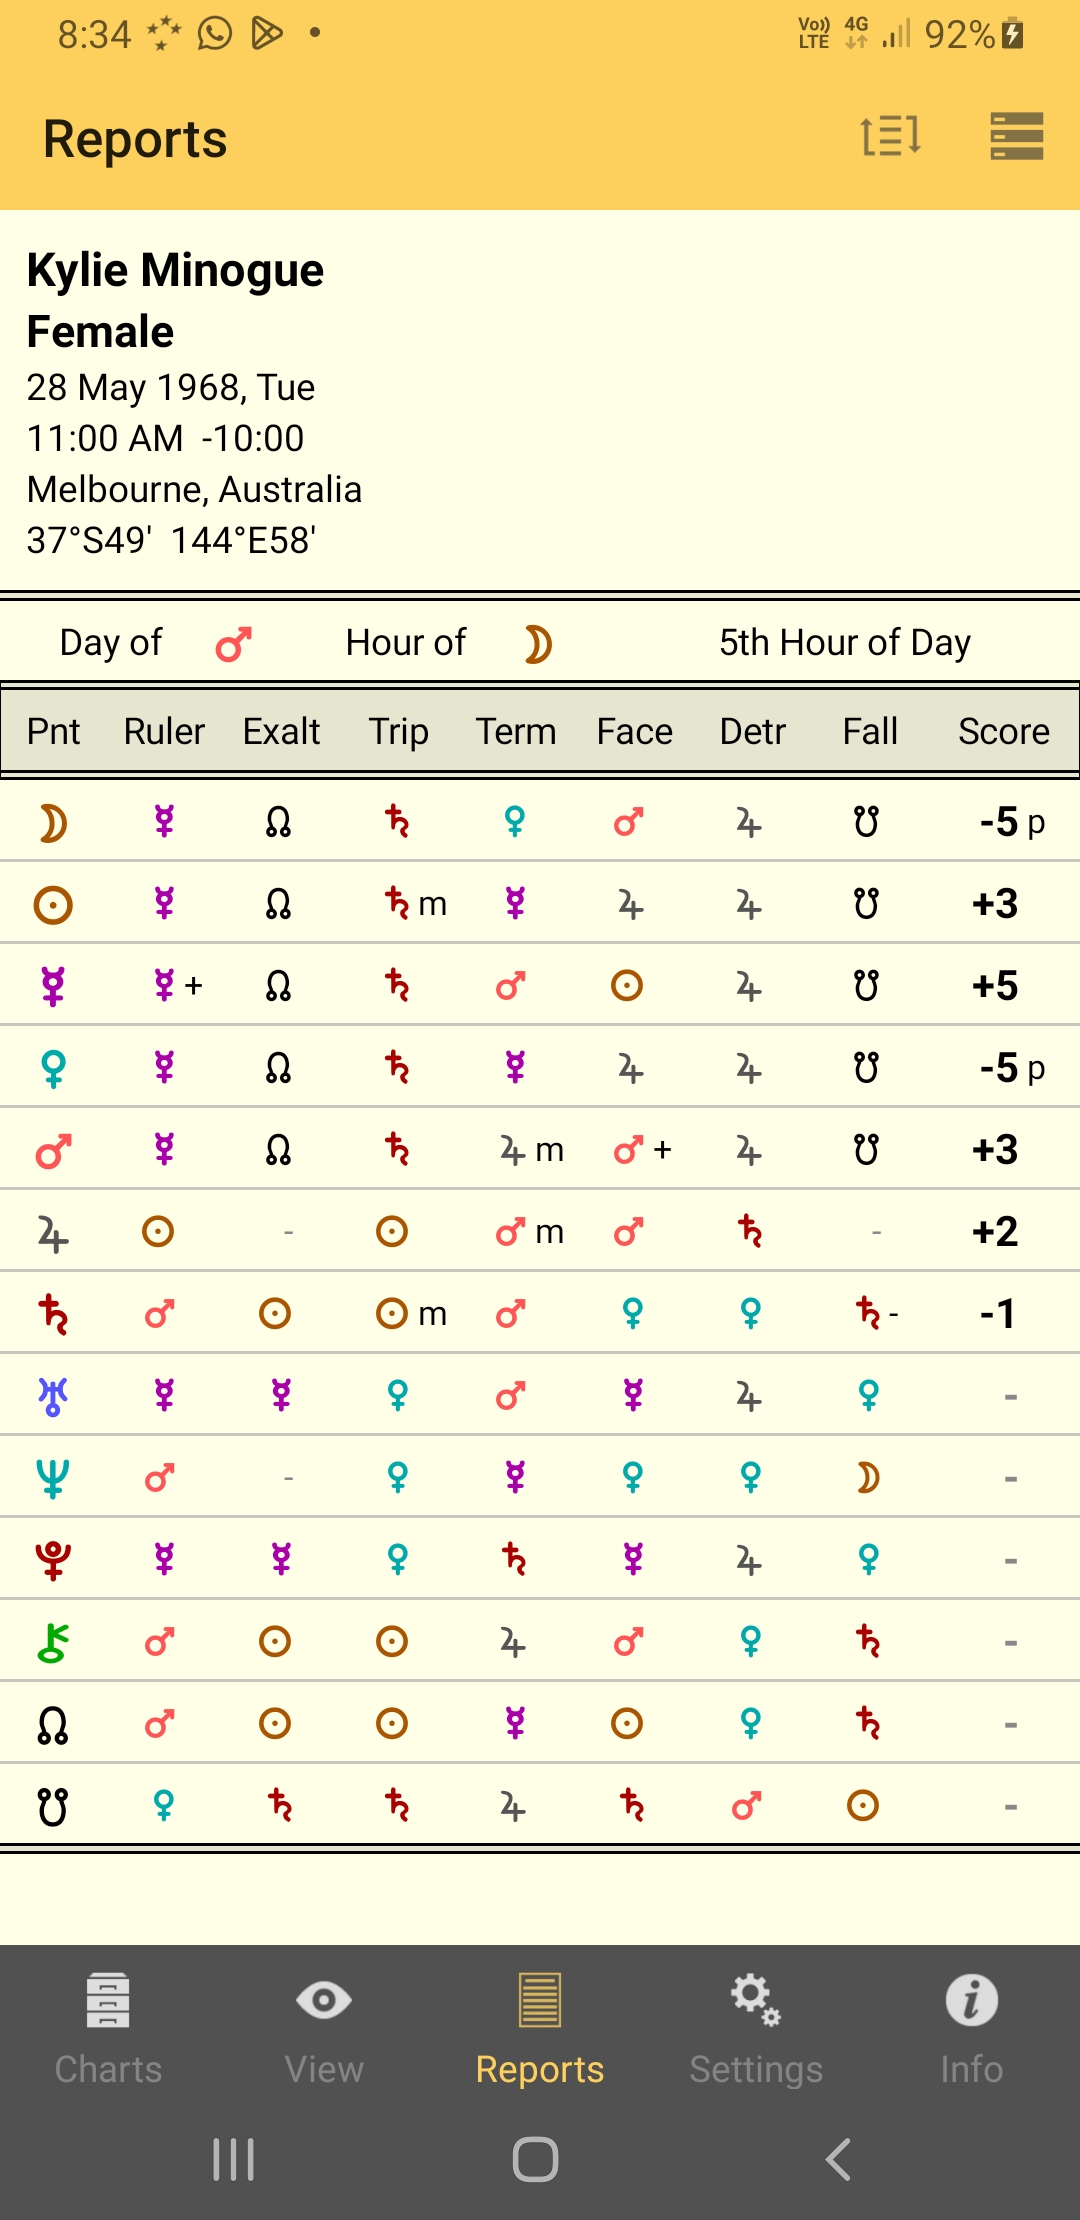
Here are the Essential Dignities for a chart. If more than one chart is selected each chart will be shown one after the other.
|
Sorting
To sort the list tap on the Sort icon in the TOOL Bar, next to the "Menu" icon. Then tap on the sort option you want.
|
Midpoint Sort
Here is a Midpoint Sort for a chart. If more than one chart is selected each chart will be shown one after the other.
|
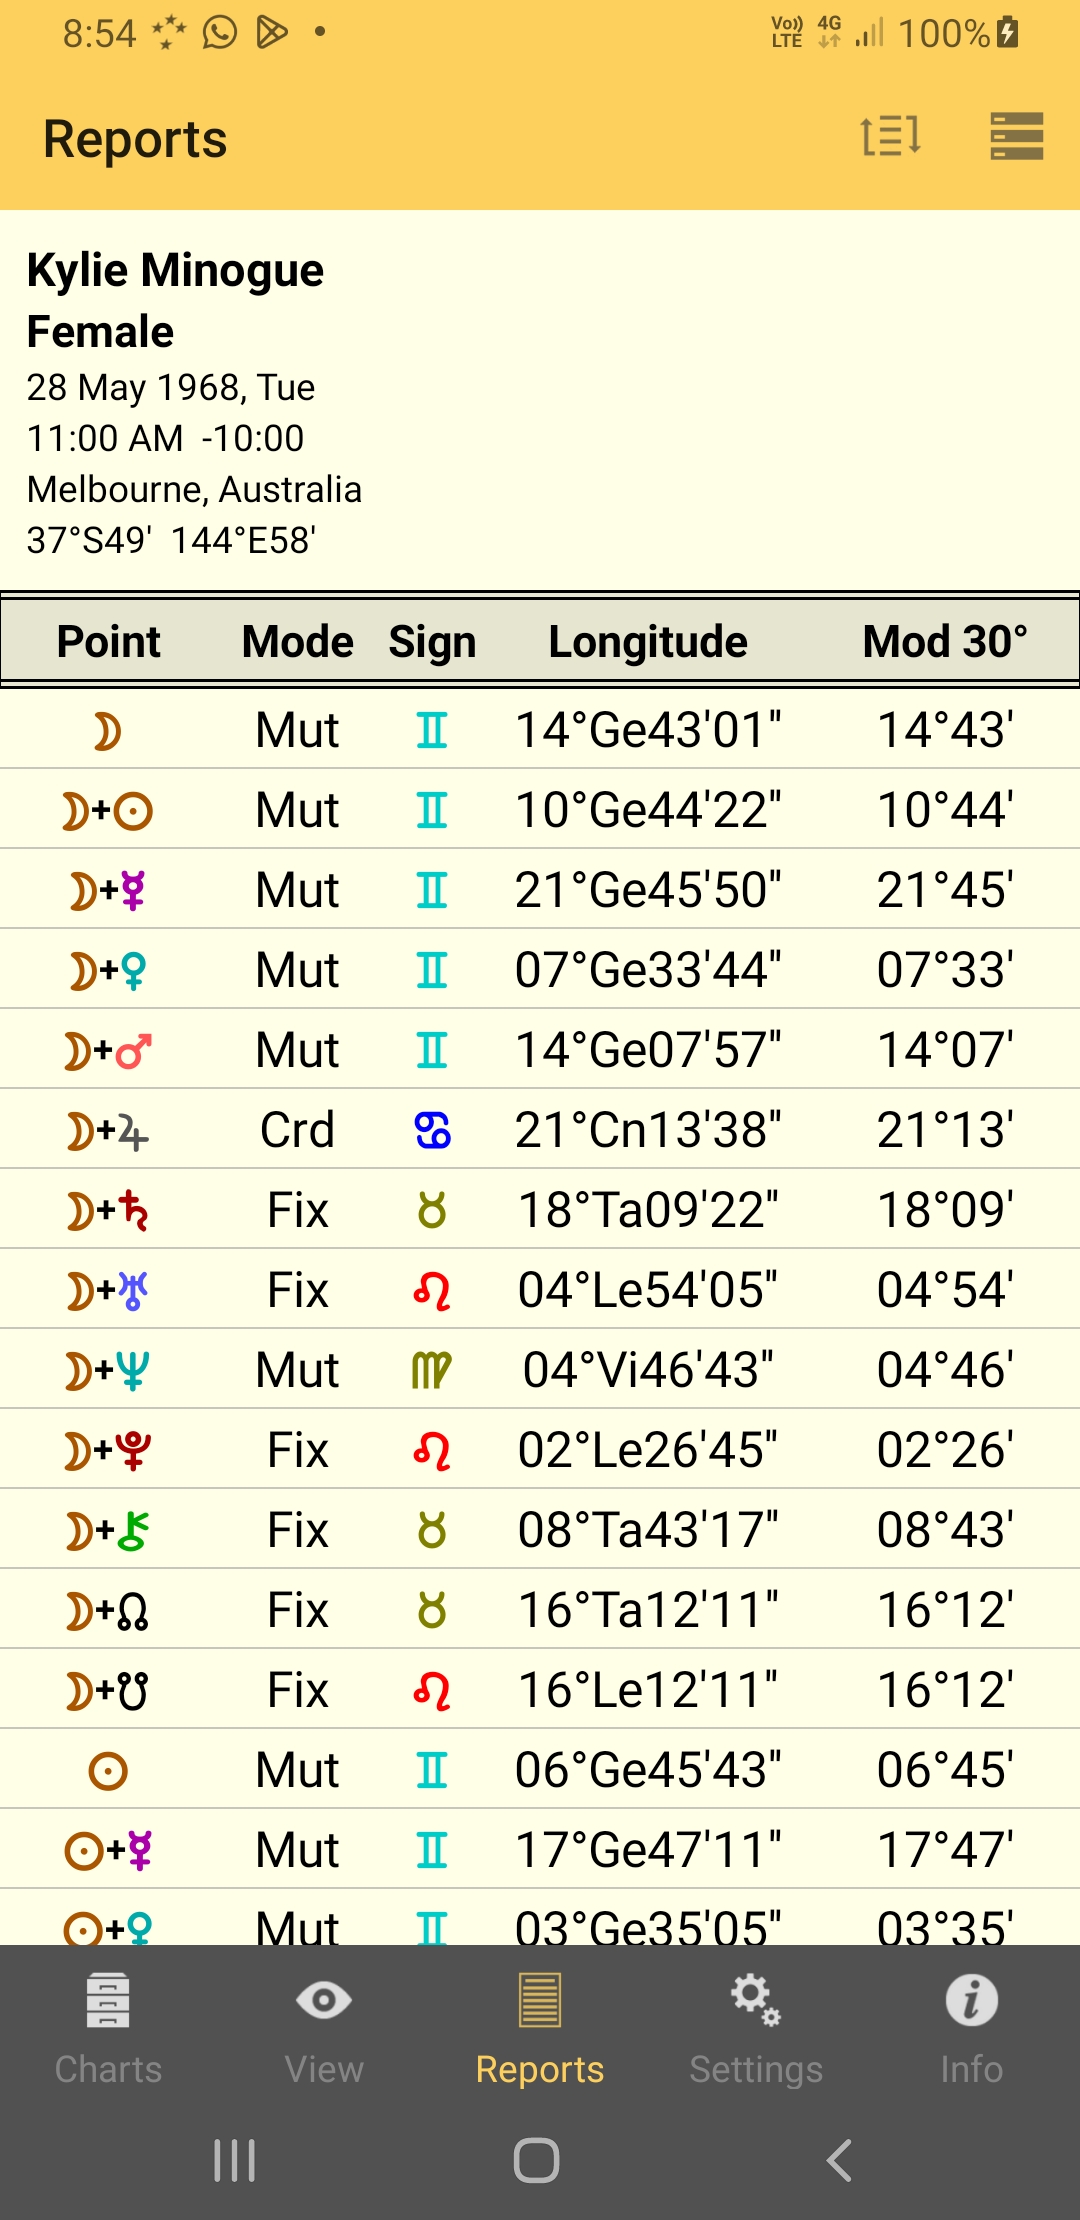
Columns (left to right)
Point: the midpoint.
Mode: (cardinal, fixed or mutable)
Sign: sign
Longitude: longitude
Modulus: the column header shows the selected modulus applied to the zodiac. The column itself shows the modulated (dial) position of the point. If the modulus is 360 then the modulated position is the same as the normal zodiac position (which has 360°).
Sorting and setting the Modulus
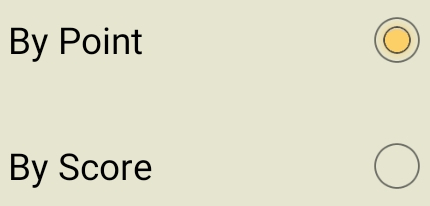
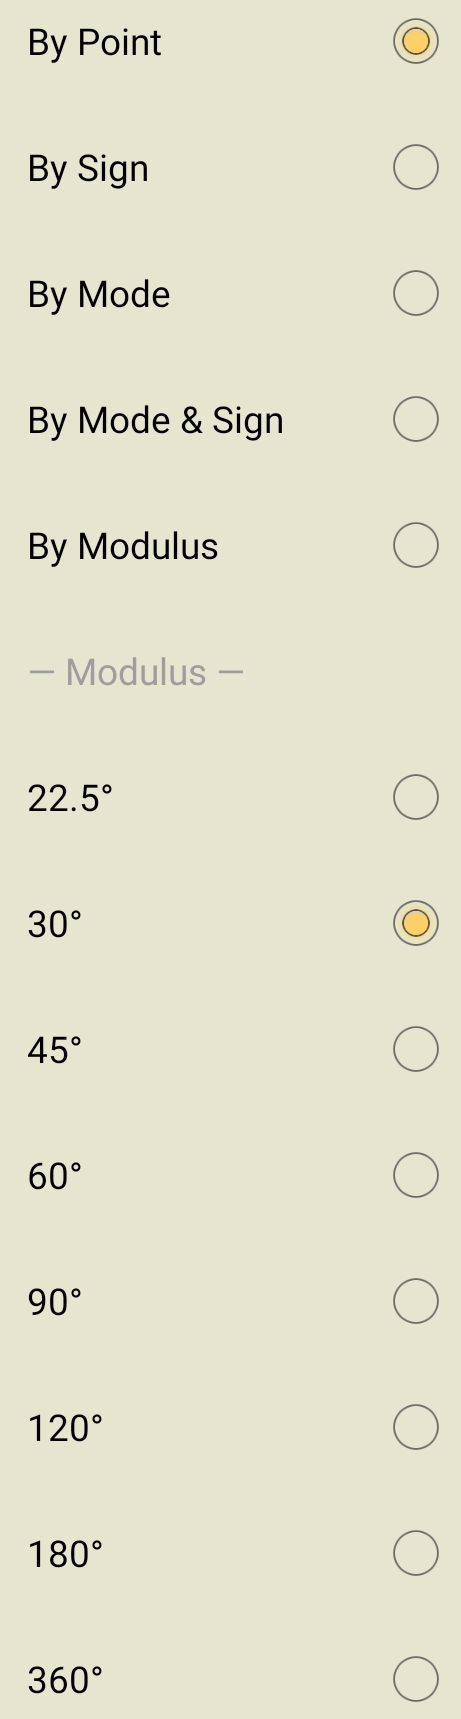
To sort the list tap on the Sort icon in the TOOL Bar, next to the "Menu" icon. Then tap on the sort option you want. And/or to set the modulus tap on the modulus value you want.
|
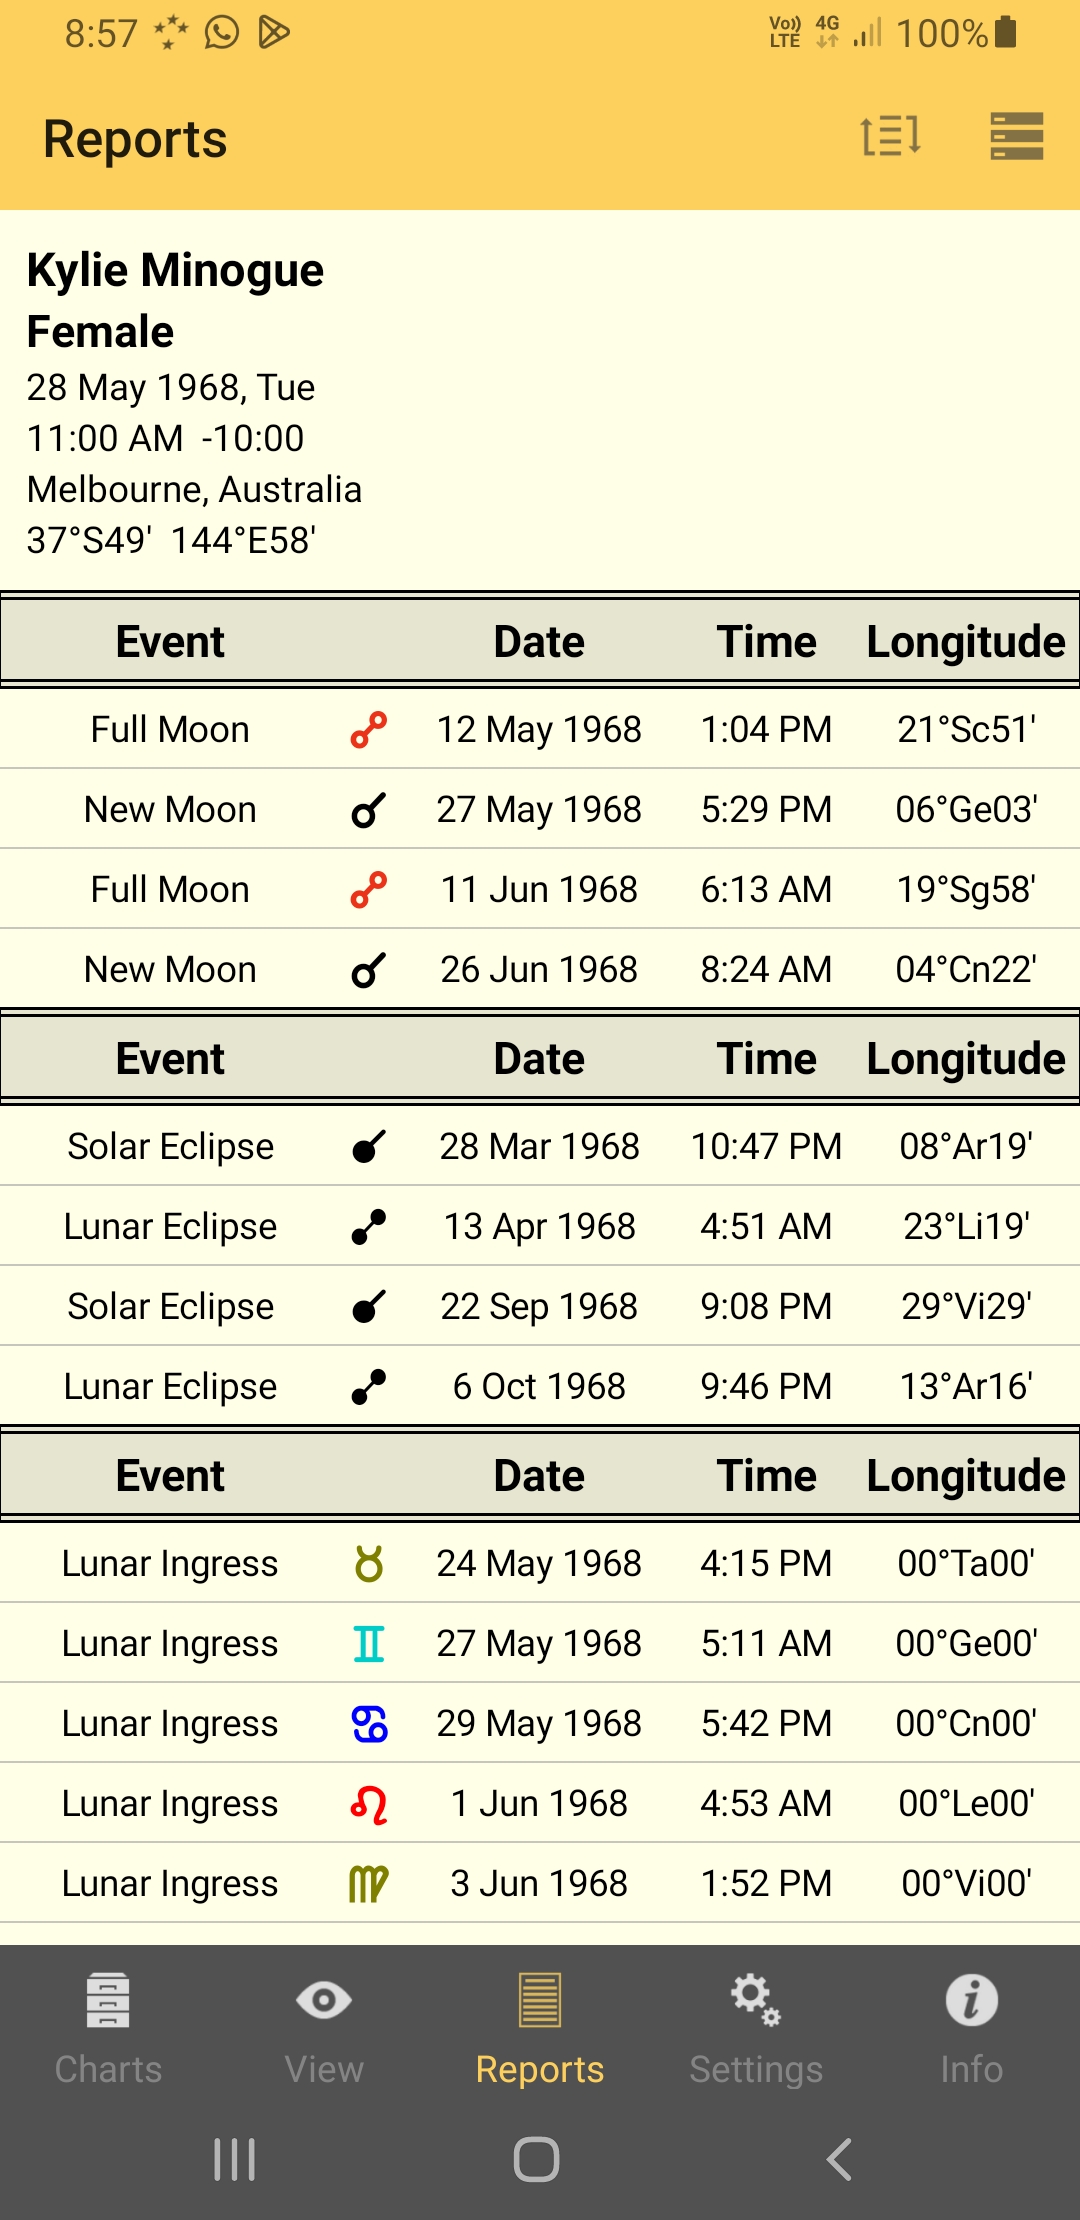
Lunar Events
Here is a Lunar Events Report for a chart. If more than one chart is selected each chart will be shown one after the other. No sorting is available for Lunar Events.
|
Dynamic Listing
Here is a Dynamic Listing for a chart. If more than one chart is selected a listing will only be shown for Chart 1.
|
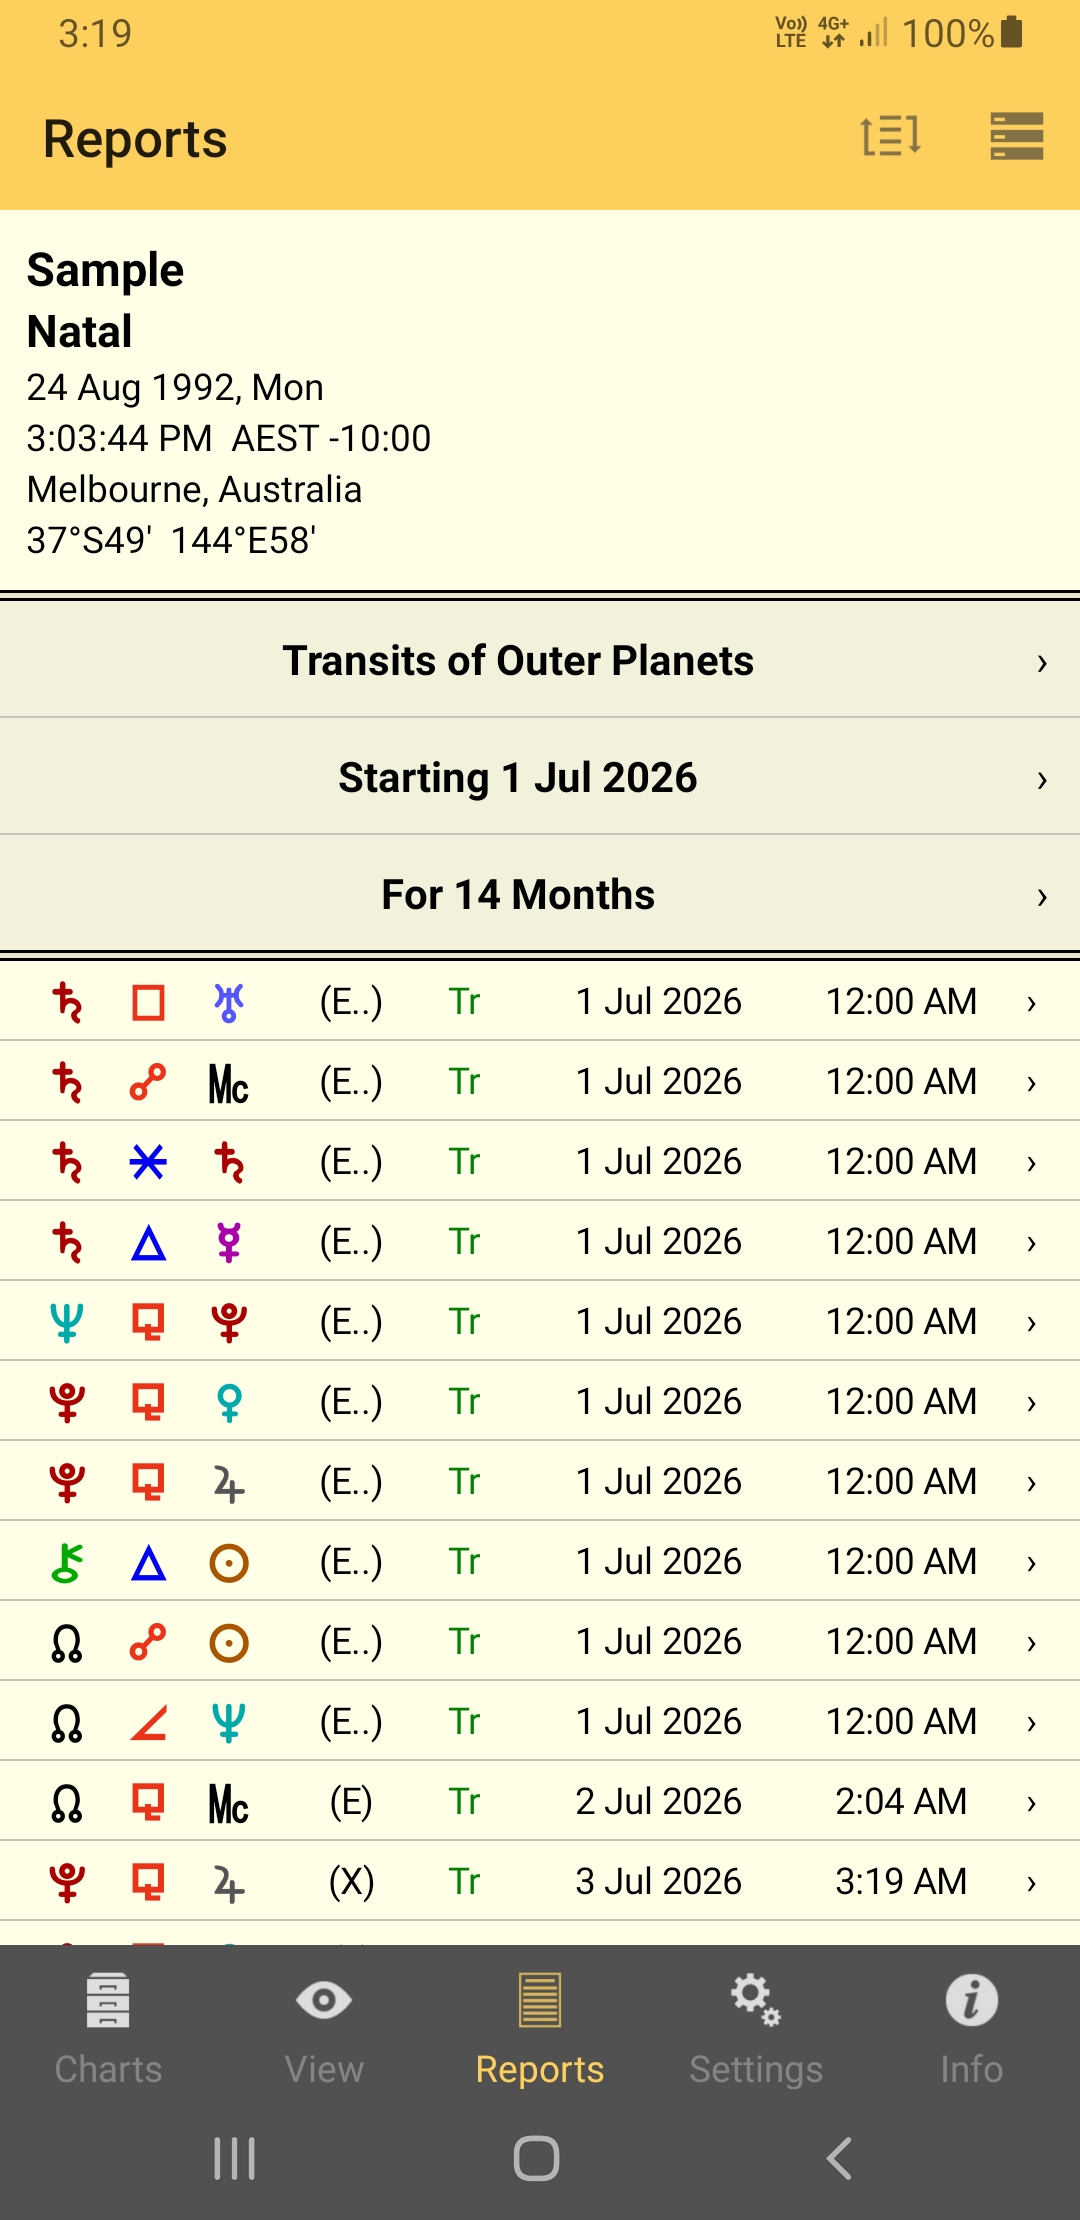
Columns (left to right)
1 |
Dynamic Point (Point 1): |
e.g. the transiting or progressing point |
2 |
Dynamic Event: |
the aspect between the dynamic point and the radix point |
3 |
Radix Point (Point 2), Sign or House: |
if a point... then this is usually a natal chart point |
4 |
Dynamic Event Motion Status: |
E.. = already entered into orb before the report period starts |
5 |
Dynamic Type: |
Tr = Transits Sp, Tp, Mp = secondary, tertiary and minor Progressions Sa, Aa, Va solar arc, ascendant arc and vertex arc Directions
NOTE: This only shows the From Dynamic type. To see the To Dynamic Type tap on the event in the list and the resulting Interpretations pop-up will say what the radix (To) Dynamic type is that is being aspected. |
6 |
Event Date |
|
7 |
Event Time |

 full moon eclipse
Sorting
To sort the list tap on the Sort icon in the TOOL Bar, next to the "Menu" icon. Then tap on the sort option you want.
|
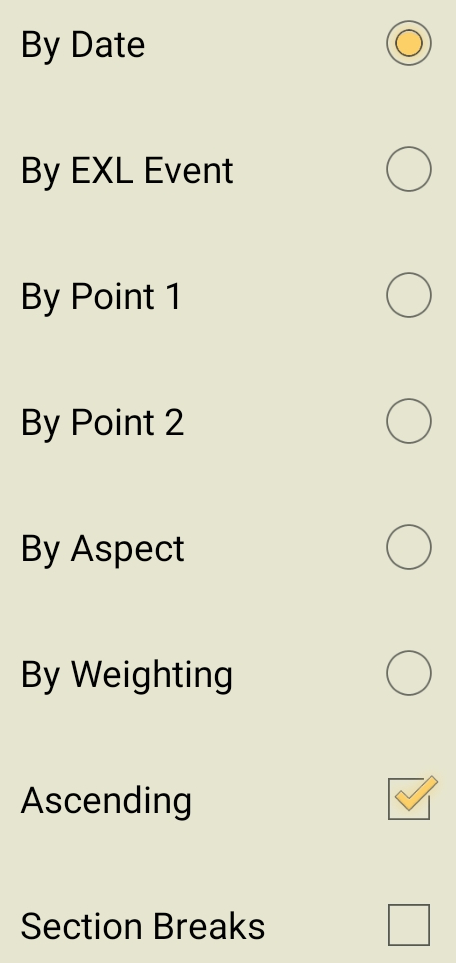
By EXL Event: (works best when the extra event "enter/leave orb events" are switched on in the Dynamic Job).
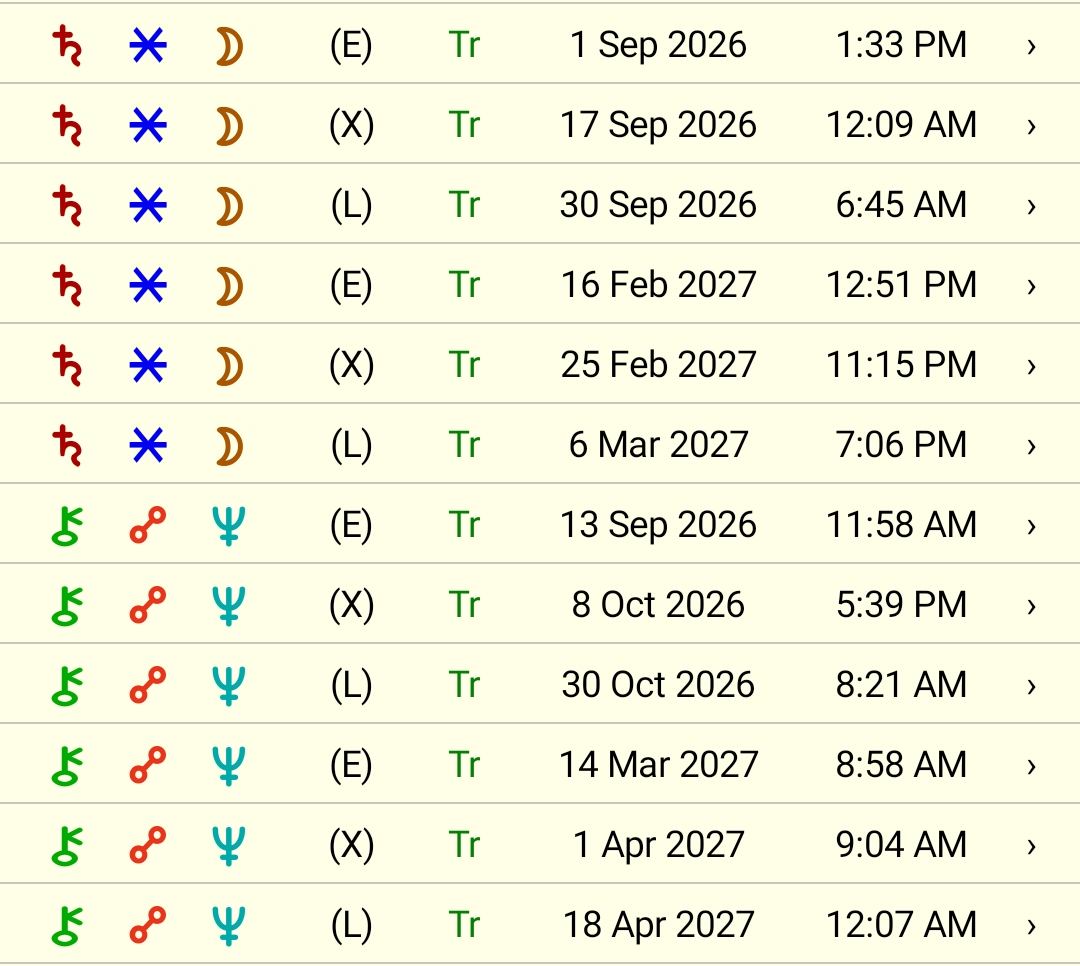
For each different dynamic event: gathers all the entering dates, all exact dates, and all leaving dates into consecutive rows in the listing creating a group, ordered by date ascending within the group, starting with the first dynamic event in the list to enter into orb, then the next dynamic event that enters into orb, and so on.
For example, below are two EXL groups.
The first group, encapsulating the entire¾’¶ dynamic event, starts with the event entering into orb on 1 Sep 2026. Every entering, exacting or leaving incident regarding that event is listed in chronological order, revealing in a concise, highly accessible way the entire lifetime of that dynamic event.
The second group, encapsulating the entireÂàÀ dynamic event, starts with the event entering into orb on 13 Sep 2026. In this native's life, this is the very next event that becomes active after the¾’¶ event starts on the 1 Sep 2026. Both events overlap for a while in 2026, being active simultaneously from 13 Sep 2026 to 30 Sep 2026.
Interpretations
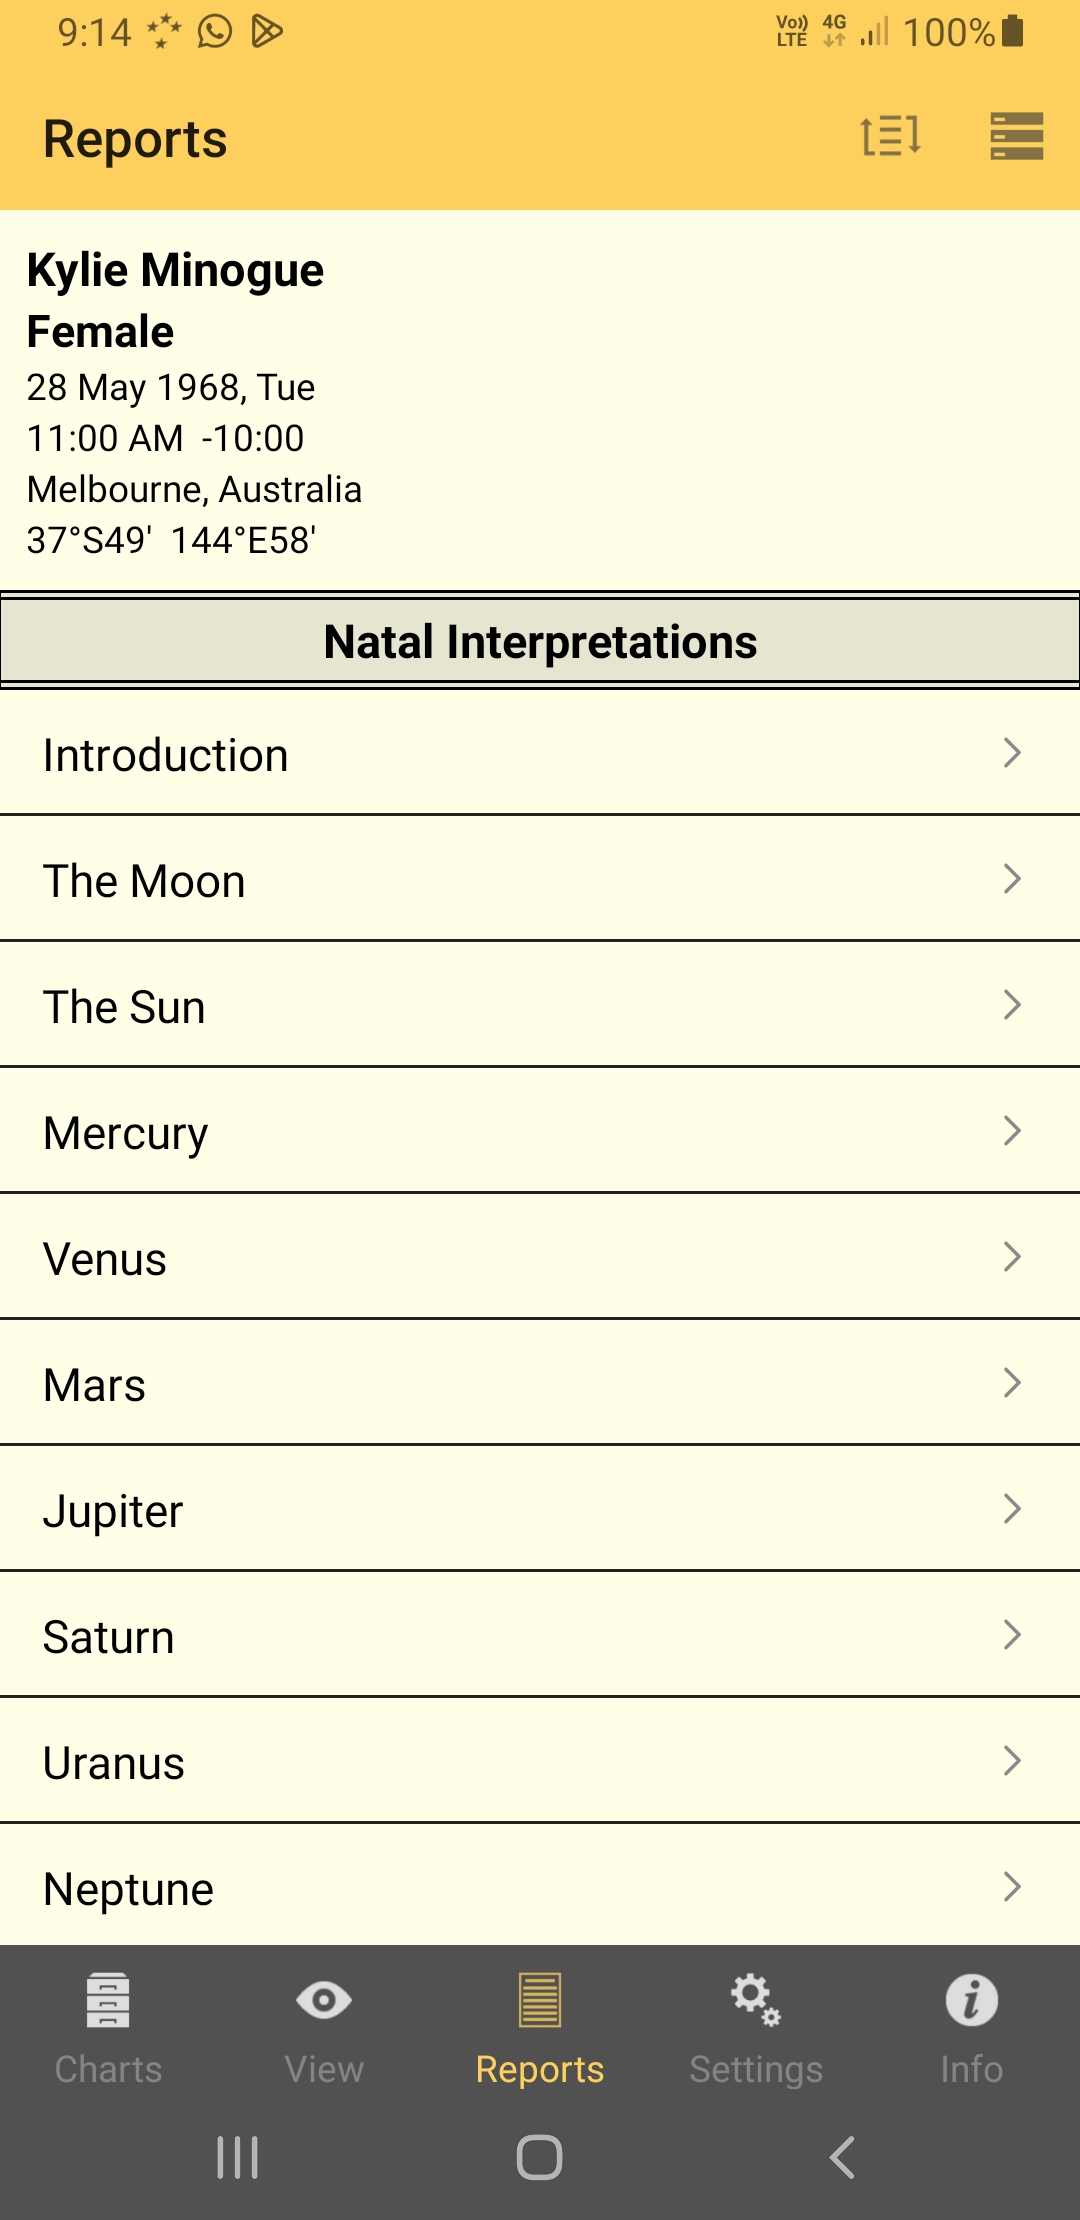
➢ When a single chart is selected the Interpretations Report is broken up into the following sections: an Introduction section, a section for each of the Displayed Points (planets, nodes, angles) and a section about the author of the Report.
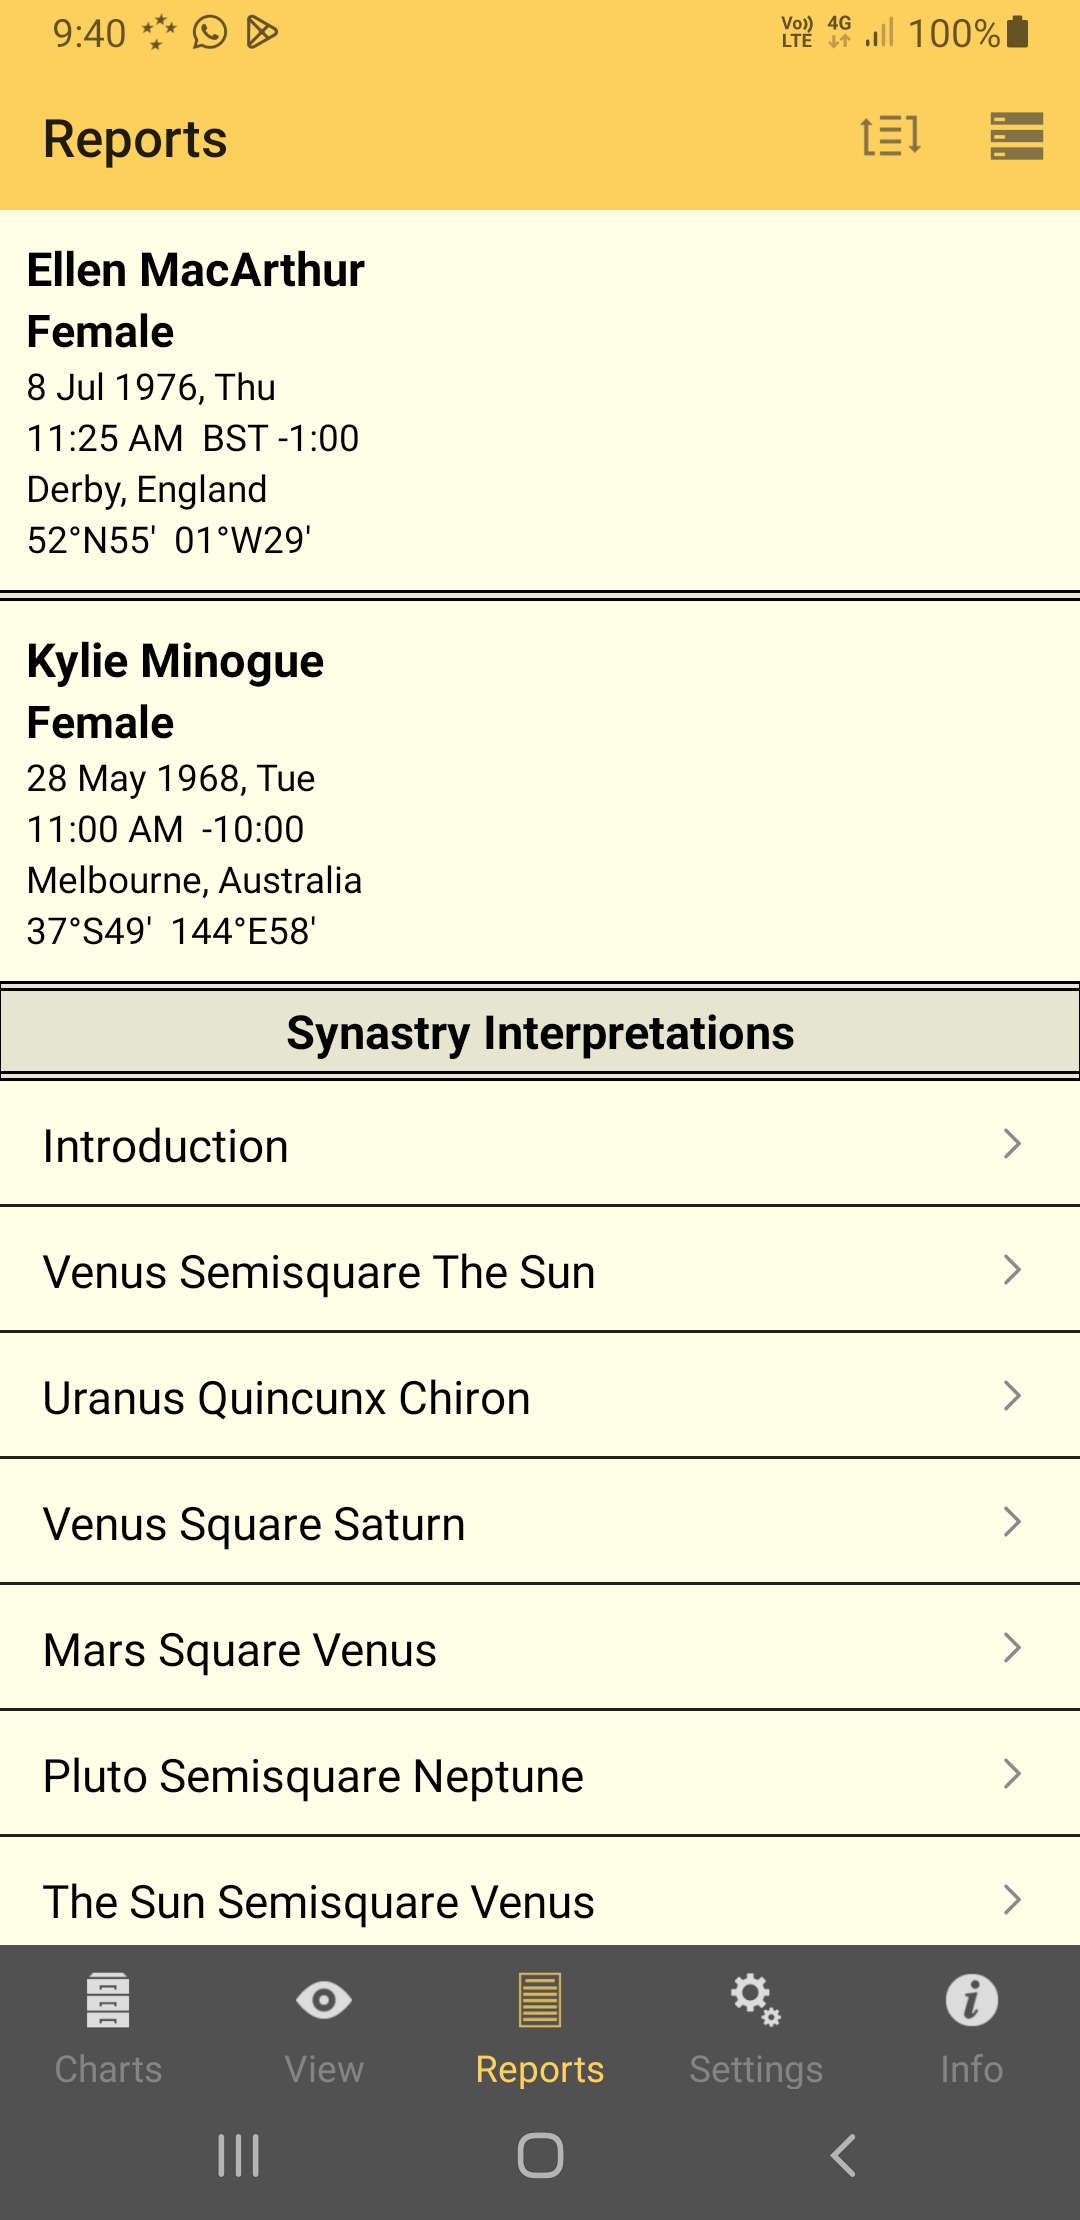
➢ When more than one chart is selected the Interpretations Report is broken up into the following sections: an Introduction section, a section for each of the Synastry (inter-chart) aspects, and a section about the author of the Report
1)Tap on a section to read its contents
2)Tap on the Report tab in the TAB Bar to return to the main Report
A section for a Displayed Point contains the text about the point generally, about the point in its sign and house, and about its aspects.
|
Below is a Synastry Report. Here the sections are for each aspect between the Displayed Points in Chart 2 (Ellen MacArthur) and the Displayed Points in Chart 1 (Kylie Minogue).
|
>> To exit from the Reports pane
➢ Tap on any tab in the TAB Bar at the bottom of the screen to move to that section of the application.