1.Tap the Charts tab at the bottom left of the screen to open the "Selected Charts" pane.
|
 |
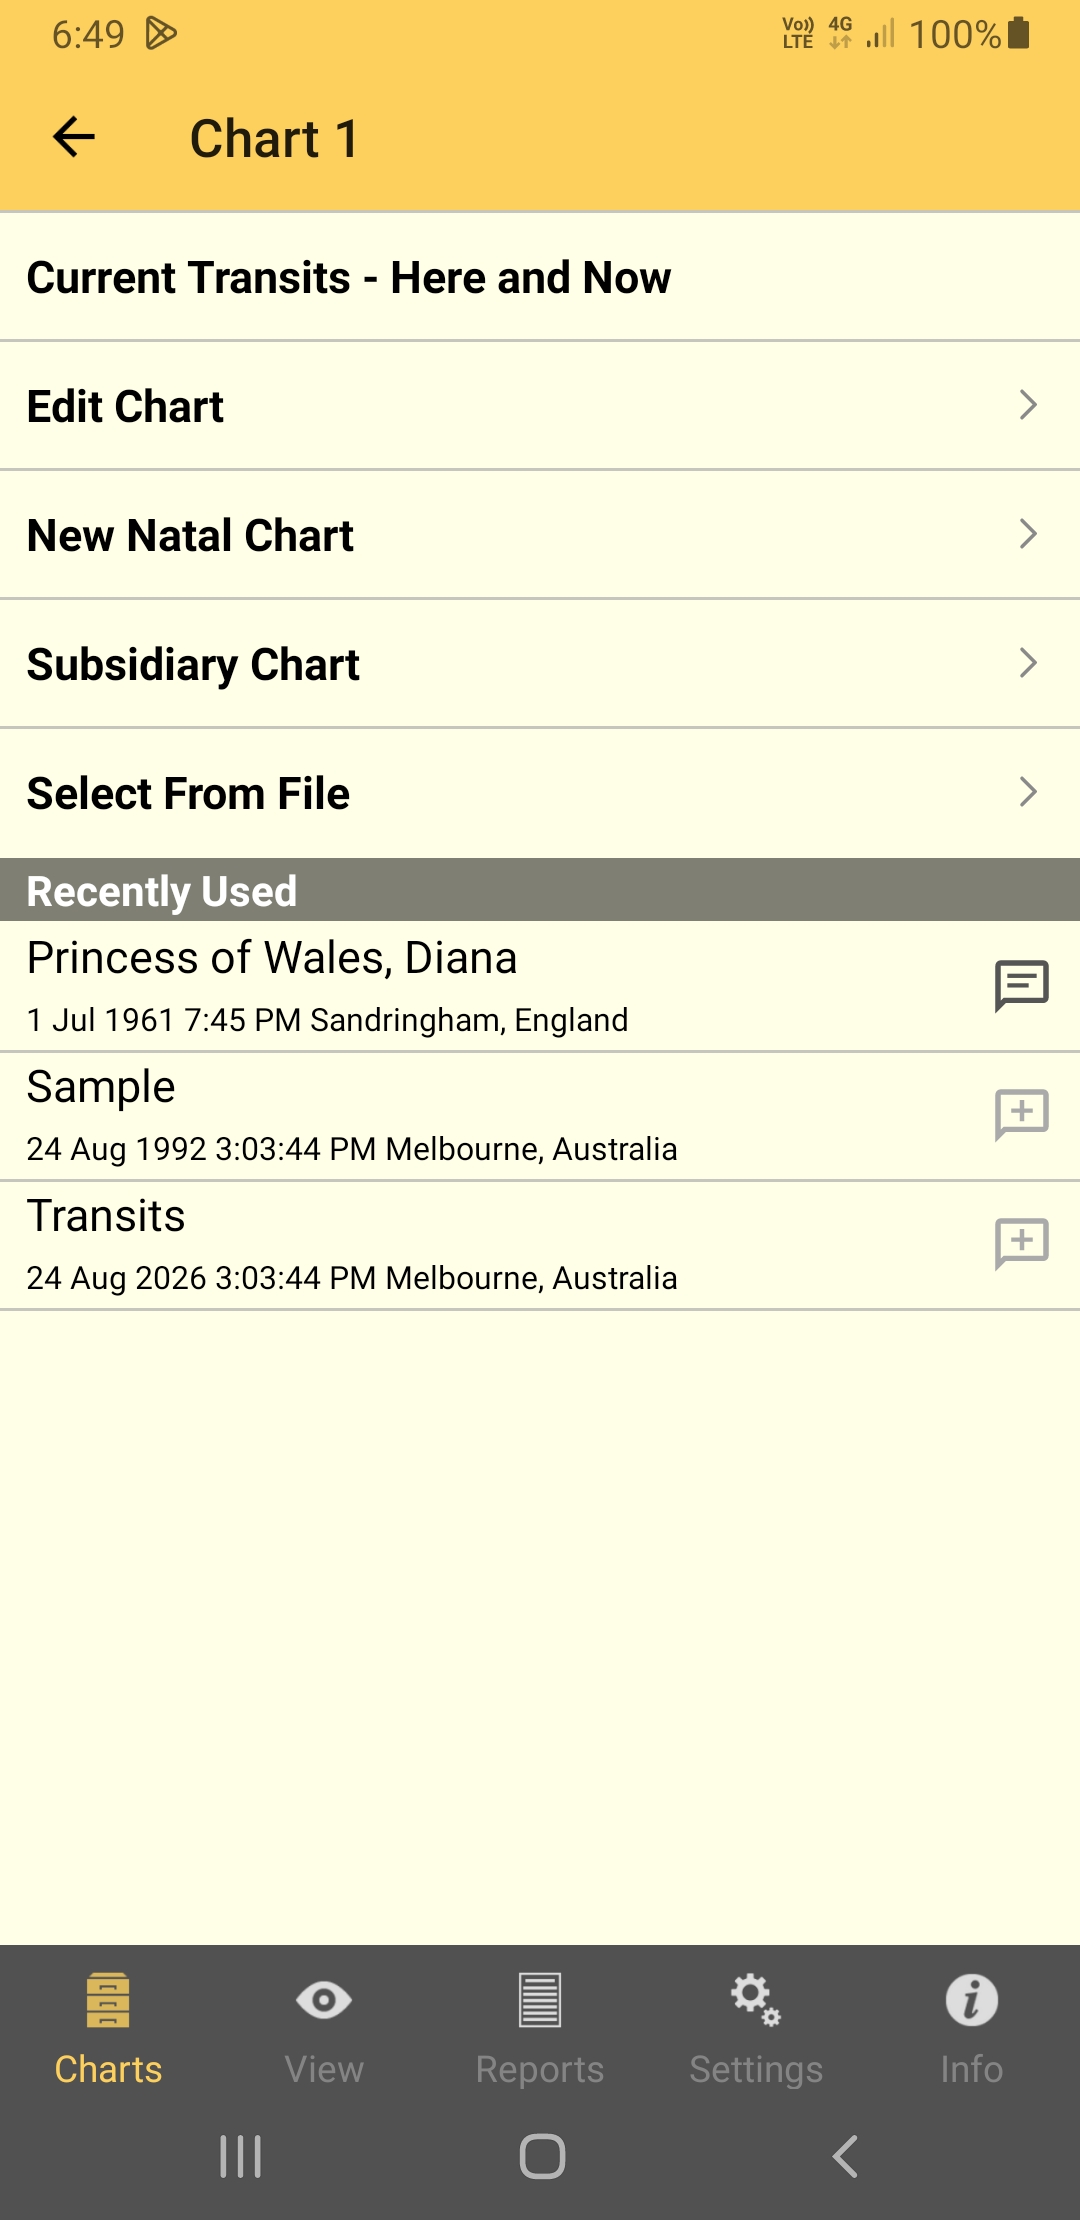
2.Select the number of chart(s) you want to work with, from one to three charts, by tapping either the 1 Chart, 2 Charts or 3 Chart button.
|
|

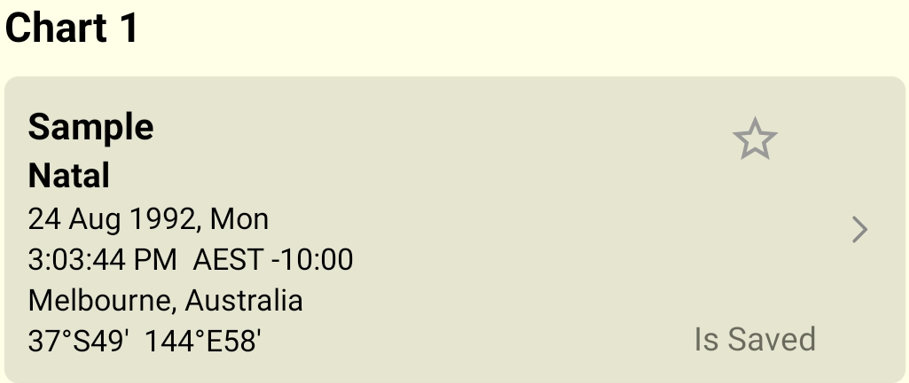
3.Then for each chart position: tap in the Chart Details pane (e.g. for Chart 1) to access the options for selecting that chart. Tapping anywhere in a "Chart Details" pane opens the chart (selection) options for that pane, or you can select a chart directly from the Recently Used list.
4.When you have selected a chart from the options for that chart position, tap on the Return Arrow  in the top left of the screen to return to the "Selected Charts" pane. Repeat for the 2nd and/or 3rd chart position(s) if you chose to work with "2 Charts" or "3 Charts"
|
|
|
|
5.After you have selected the chart(s) and returned to the "Selected Charts" pane, tap the View Tab to display the chart(s).
 |
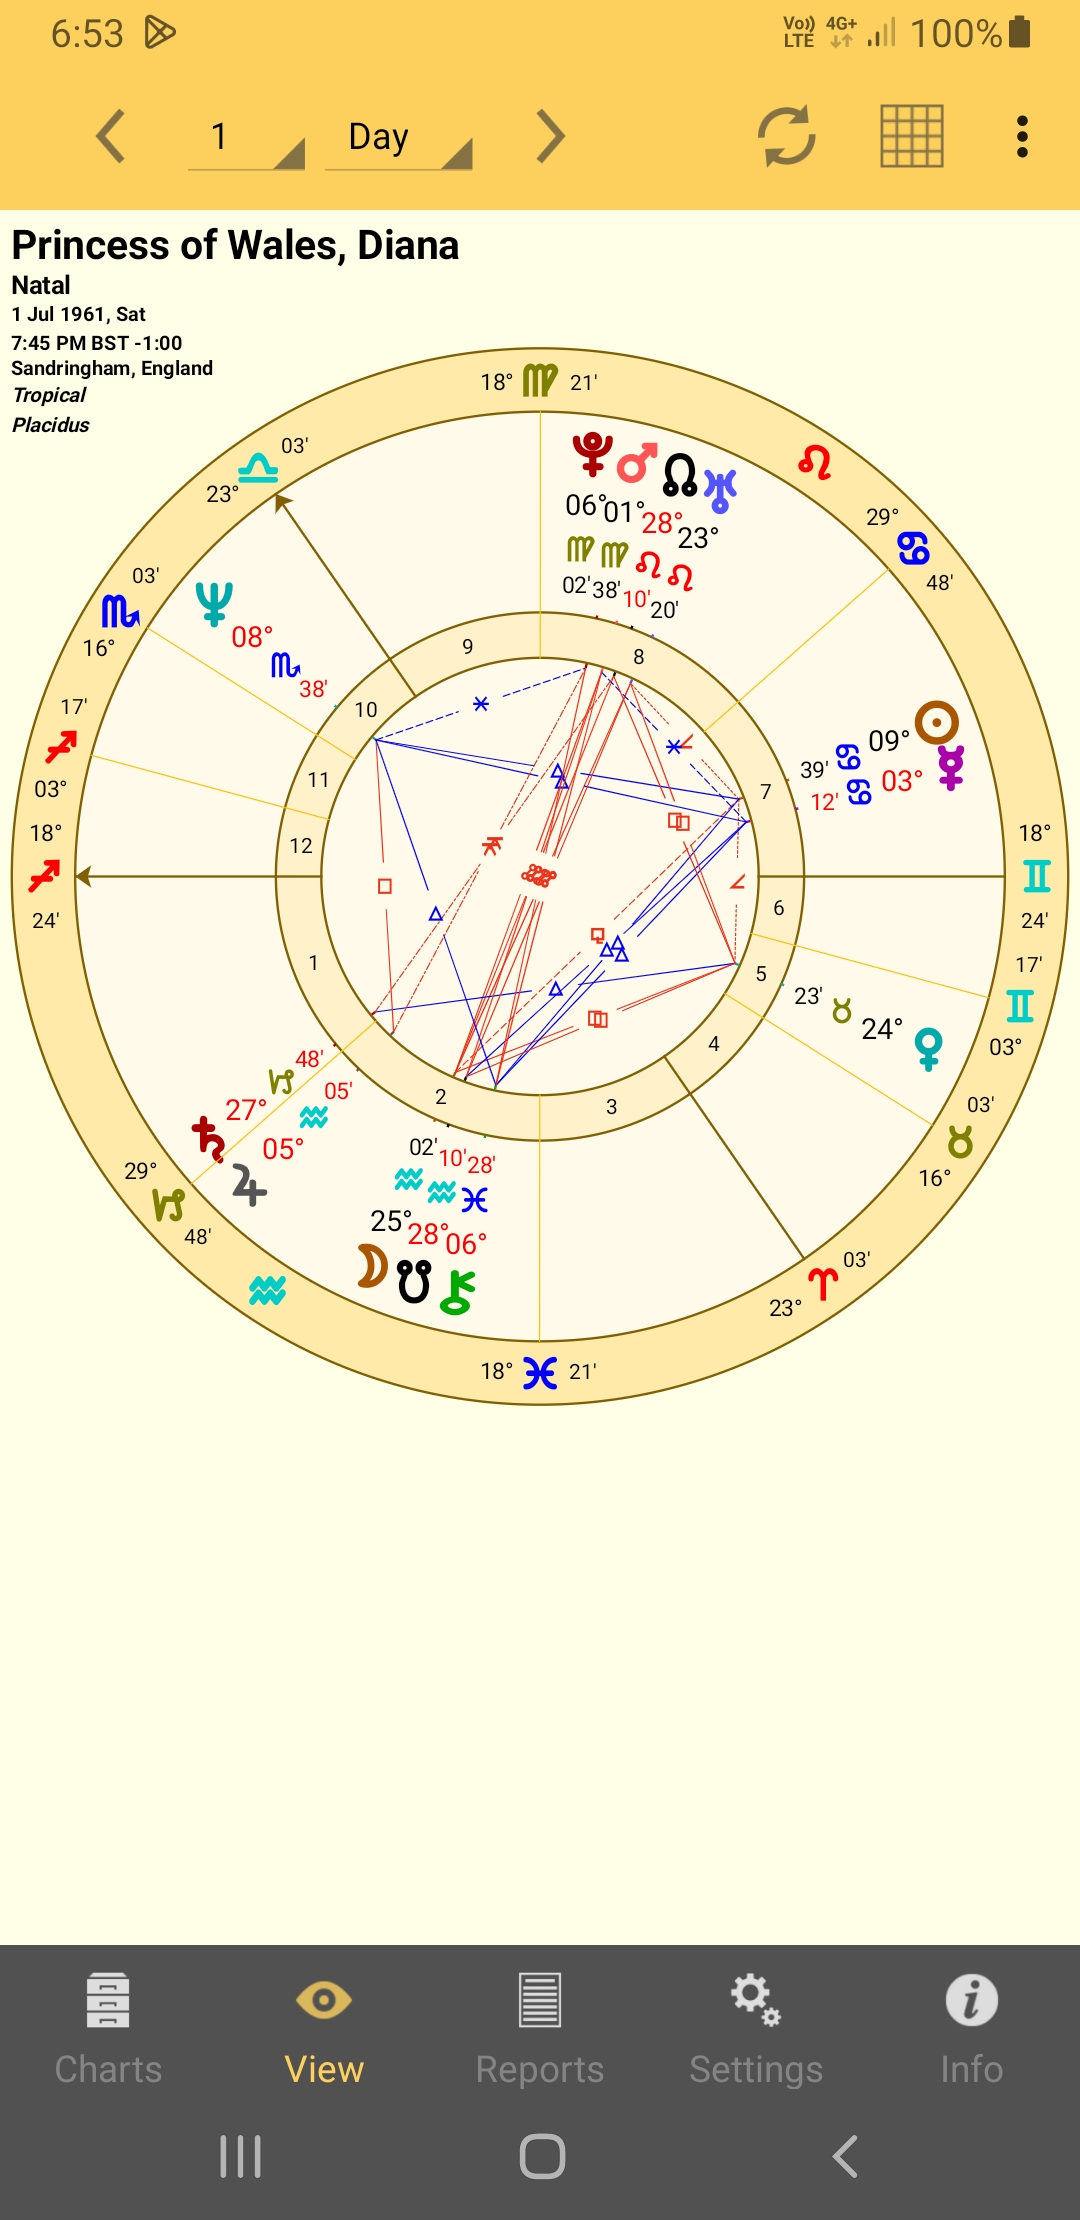 Single chart displayed |
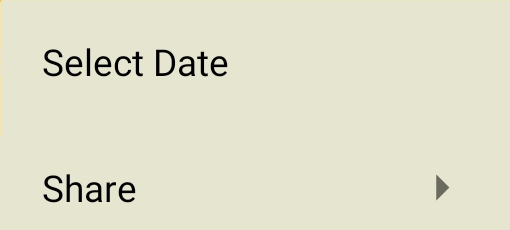
6.You can then tap the Action button  in the top right of the "View" pane to see a pop-up menu. From this menu you can either change the Date of the chart or Share the chart with other people using a variety of methods.
|
7.Tap the Reports tab in the bottom middle of the screen to see listings of basic chart data, chart (or synastry) aspects sorted by point or by aspect orb, or (if you selected more than one chart) transits to the first chart, and interpretations. Tap the menu icon  in the top right to select the data you want to see.
 |
At any time you can use the Settings tab at the bottom of the screen to change all settings relating to chart display, calculation and transit options etc:
•Before you start using AstroGold to cast new charts, you might like to set the Home Location, as this is used as the default location for all transits charts.
•Depending on whether you prefer to see charts on a light or dark background you might also like to set the Chart Display item under Wheels & Colors.
|
 |
General Use
The main pane of the application is the "Selected Charts" pane (accessed from the "Charts Tab" at the bottom left of the screen), which acts as a hub, with everything else you do revolving around this screen.
That's because before displaying any charts, transits or aspect grids, one or two charts have to first be selected. You can always jump to the "Selected Charts" pane by tapping the "Charts Tab", in the bottom left corner of the screen, from anywhere in the application. Whatever else you were doing on the screen you were previously on will usually be preserved until you later return to that screen.
So it could be likely that this is the screen you gravitate to the most often, changing which charts you want to use on a regular basis, before using the "View" pane and the "Reports" pane.
However, if you are just interested in seeing data for one or two charts most of the time, then once those charts are selected you will mostly exclusively be in the "View" pane, or the "Reports" pane.