Here is a brief tutorial on how to set up a Graphic Ephemeris.
>> To set up a Graphic Ephemeris
1.Create or select a natal or event chart to use as a base chart in the Chart 1 position. See Quick Start for how to create a new chart. You may also opt to select an already created chart - see here for how to do that.
2.Click the  icon in the Toolbar, or in the View menu click on Graphic Ephemeris. You should now see the "Graphic Ephemeris" window where you can set up your ephemeris calculations.
|
|
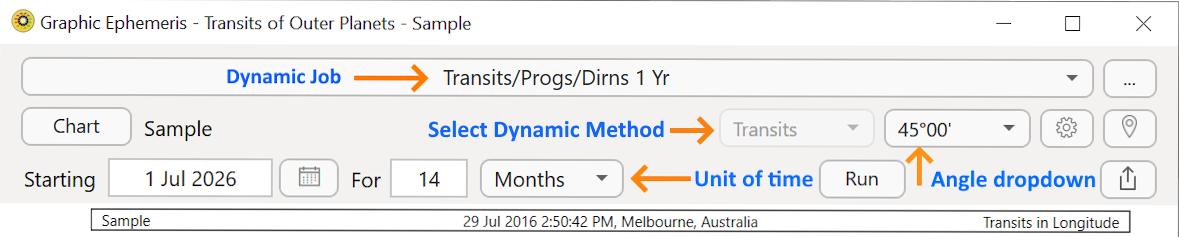
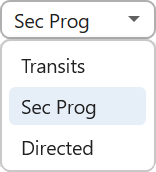
3.To the left of the "Angle dropdown", clicking on the Select Dynamic Method dropdown will give you the option to choose one of the following calculation methods:
•Transits
•Secondary Progressions
•Solar Arc Directions
Below we have selected Sec Prog (secondary progressions).
|
4.Click on the gear icon and you can choose to show or not the radix (base) chart positions, aspects, and the mundane moon's phases in the ephemeris display.
|

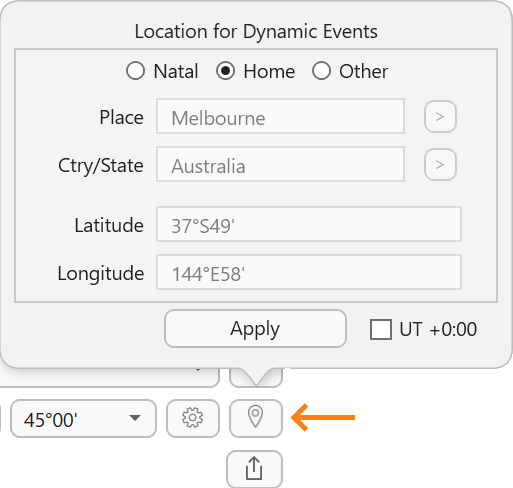
6.Click on the "Location" icon and you can choose the location where the Dynamic events are calculated (they default to the Home Location).
|
7.Once you have the settings ready, it’s time to frame the time for your Graphic Ephemeris. At the top pick a starting date, a length of time, and the degree range for the vertical axis (for example, you may want to only show 30 degrees, or 45, or 180, or even a full 360).
8.If everything meets your satisfaction, you can go ahead now and click the Run button to create the Graphic Ephemeris.
9.There’s one more setting you should know about. Click on the Share button  and you can choose to save your resulting ephemeris, print it, or post it on a popular social media website etc.