Astro Locality is the projection of astrological factors onto a map of the world.
An astrology chart will change as its location changes, firstly because its angles (ASC, MC, DESC, IC) will change, which in turn will usually change which house each chart point is in, plus the aspects from the chart points to the chart angles. When one spends time in a different location to one's birth place, then one experiences one's chart in an altered way because of these reasons. By using astro locality mapping techniques we can see what in our chart will change as we move to various places on the globe.
The primary function of astrology locality mapping is to draw lines across the map showing where a particular astrological factor would occur for any particular time. In Astro Gold there are two main kinds of calculation used to do this, giving rise to two similar sets of lines: Culminating/Anti-Culminating/Rising/Setting lines (in Mundo) and MC/IC/ASC/DESC lines (Zodiacal).
1)In Mundo calculation - which is based on the right ascension and declination of each planet in the chart, and thus can show where on the map a planet will be rising at the eastern horizon, culminating overhead, setting at the western horizon or crossing underneath one's feet on the other side of the globe. These lines are based on mundane measurements.
2)Zodiacal calculation - which is based on the celestial counterparts to these measurements, celestial longitude and latitude, and shows where on the map a planet will be rising at (conjuncting) the Ascendant (ASC), or conjuncting the Midheaven (MC), Descendant (DESC) or Imum Coeli (IC). These lines are based on ecliptical measurements.
Astro Gold also produces a third type of line based on the local horizon and meridian, called Local Space lines. These lines reflect the fact that the In Mundo or Zodiacal calculations do not produce lines on a map that are very different from each other - this is because whether one uses right ascension and declination (In Mundo measurements) or ecliptical latitude and longitude (Zodiacal measurements) to pinpoint the "position" of a planet in the sky, the position of the planet in the sky doesn't change much.
However to an observer on Earth the position of a planet in the sky, relative to the observer's position, does change a great deal when observed from different places on the globe.
The most obvious case of this is when someone observes a planet from the northern hemisphere and the planet appears to them as being on their southern horizon, while someone else looking at the same planet from the opposite side of the globe (and thus also in the southern hemisphere) will observe it as being on their northern horizon.
With Local Space lines the azimuths of the planets are drawn on the map. These lines extend out from the chart's location, following a path towards the observable position of the planet in the sky at the time of the chart until the line comes to the horizon, and disappears out of view as it continues around the globe, eventually to return to the chart's location from the opposite horizon from which it started towards.
See Astro Locality Principles for a more detailed explanation of the principles upon which astrology locality mapping is based.
>> To open the Astro Mapping Module
➢ If the Astro Mapping module isn't already open - click on the View menu, then click on Astro Locality Maps. Alternatively click the globe icon  in the Toolbar. Chart 1 will be displayed in a world map.
❖ Alternatively in the "Selected Charts Pane" on the left, for the chart you want to display in the Astro Mapping module, click its Select button, then on View in Maps. This will display that chart in a world map.
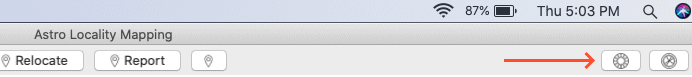
➢ Otherwise if you wish to preserve the currently displayed map, you can open a separate new map (complete with its own settings) by clicking on the "New Window" icon  in the top right corner of an existing map window title bar.
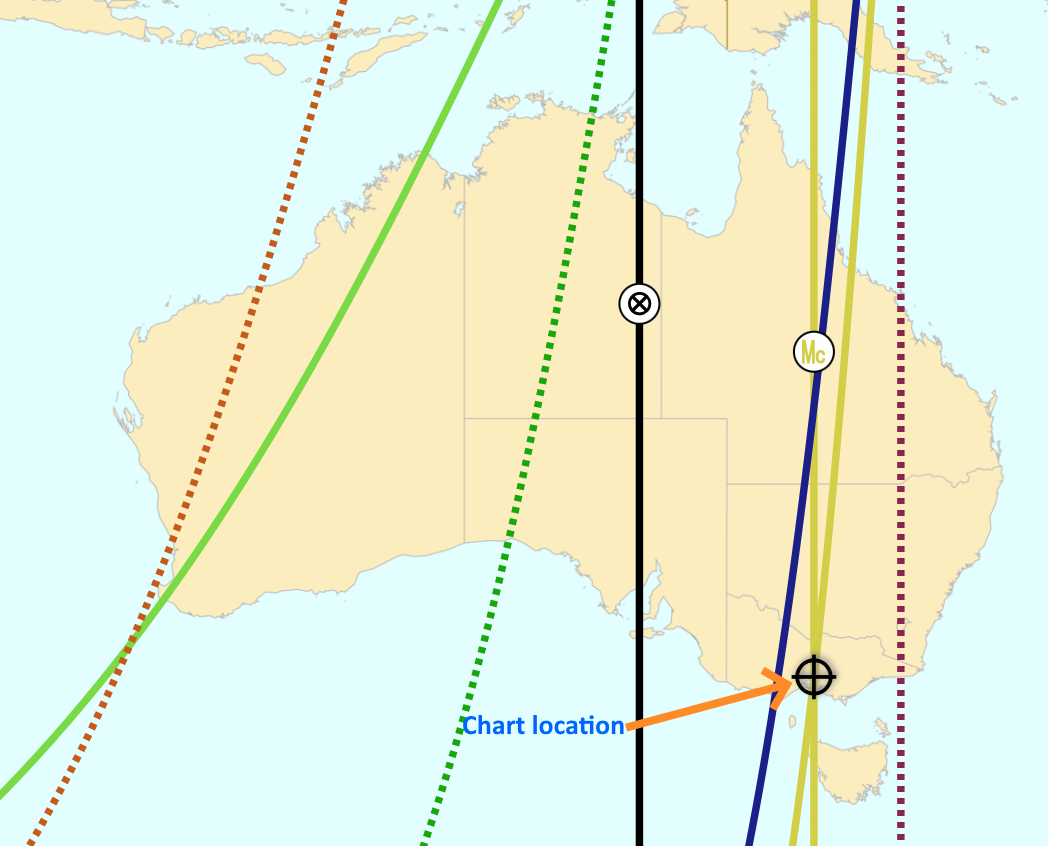
 Astro Locality Map: Local Space planetary direction lines displayed |
>> To select a different Chart
➢ In the top left of the Maps screen click on the Charts button. This will open up a menu listing all charts selected in the main app window, from which you can select another chart to use in the currently displayed Map.
>> To display the map Chart in a wheel on top of the Map
➢ In the top right of the Maps screen there are two small circles.
 |
Clicking on the first small circle displays the Map chart in a small wheel.
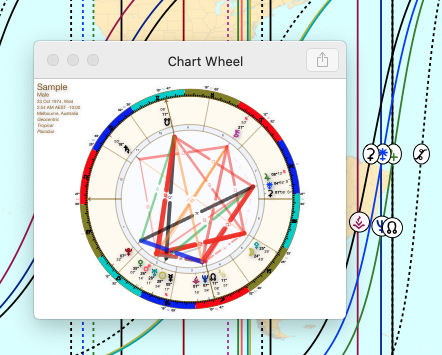 |
The map chart's location is shown with a crosshair symbol.
|
>> To change how the Map itself appears
1)When you first open Astro Locality Maps, a full World map is always displayed in the Maps window (and will be in Offline Maps mode).
2)To determine what happens when you zoom in to an area on the map, click on the Map Style button near the top left of the window - a menu will drop down.
|
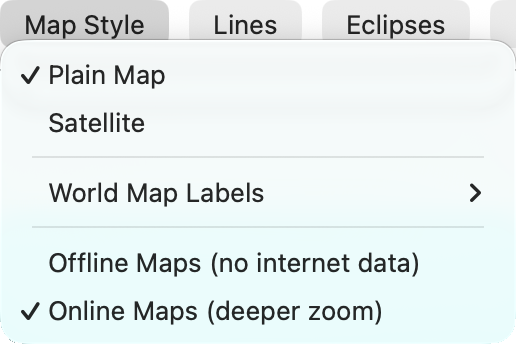
a)In the top half of the menu you can choose between seeing the map normally (Plain Map) or as a Satellite view.
b)In the bottom half of the menu click on Offline Maps to show basic country and region outlines only. Offline Maps requires no internet connectivity, but has a much more limited zoom capability.
c)Choose Online Maps for deeper capacity. Online Maps are more detailed, much better annotated and much more highly zoomable, to the extent that, for example, it becomes possible to see local space lines over a neighborhood street-level map of any location (e.g. a chart's natal location). Online Maps is the default setting.
d)If no internet connectivity is available, then AstroGold automatically reverts to using Offline maps but only for as long as the internet connection remains unavailable.
e)If you specifically select Offline Maps mode, then this setting is remembered until you choose the Online Maps mode again on some future occasion.
f)In the middle of the menu you can choose what labels you would like on your World maps: Countries, Cities or None.
>> To display different regions or parts of the Map (panning/zooming)
1)Hold the left mouse button down and drag it in the direction you want the Map to move e.g. drag left to pull the whole map to the left (which will pull parts of the map previously to the right, but off the screen, back into view); drag upwards to drag the whole map upwards etc.
2)Use the horizontal and vertical scroll bars to move the map in the direction you want it to go.
3)Press down and hold down anywhere on the keypad, and swipe on the keypad with another finger in any direction, and the map will move in the direction you are swiping.
4)You can pan (move across) the map by scrolling the mouse wheel up or down. If you hold the Shift key down while you are scrolling, instead of scrolling up or down, you will scroll left or right.
5)You can pan (move across) the map by scrolling using the keyboard arrow keys. If you hold the Shift key down while you are scrolling you will increase the step size of each movement.
NOTE: Panning is only available once zoomed in to the map to some extent. The full World map can never be panned.
6)Zoom into the map via mouse left button double-click; and unzoom with mouse right button double-click, or by holding down the Control key while mouse left button double-clicking
7)You can also zoom into the map using the zoom icons. These are in the bottom right of the Maps window.
•the plus + sign zooms into the map (makes areas larger)
•the minus - sign zooms back out of the map (makes areas smaller)
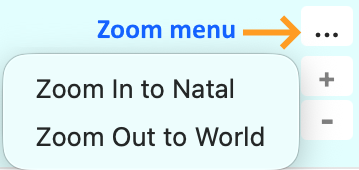
•the three dots pops up a menu, from which you can choose to zoom into the World map at the chart location (Natal), or to return to a fully zoomed out World map
|
8) You can also Box-zoom into the map. This is drawing, with the mouse, a box shape that covers the part of the map you want to zoom into.
While holding the Shift key down, click on the map where you want a corner of the box to be, then with the left mouse button drag the mouse to the opposite diagonal corner of the box you want to draw, then let the Shift key and mouse button go.
This will create a dashed line box shape on the screen. The map will be zoomed in to the area of the map that the box covers. Box-zoom works best when using Online maps, it has limited capacity when using Offline maps.
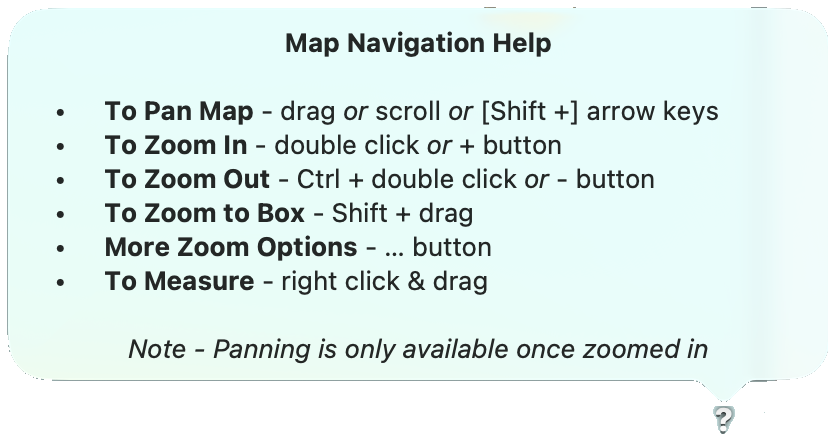
9)You can get quick onscreen Map navigation tips. In the bottom right of the Maps window, just above the zoom icons, is a question mark - clicking on that pops up these handy navigation tips.
|
>> To determine which lines are drawn on the Map
➢ Click on the Lines button to display the "Lines" dialog box, which will display the menu shown below, with different types of lines available under different tabs.
 The Lines menu for the Map |
Points
1)First decide on which type of Chart Points (if any) - Zodiacal or In Mundo.
➢ Then decide which lines of that type of Chart Point you want to see by clicking in the check-box of each of the next four items.
•Zodiacal points are based on the ecliptic intersecting with the meridian or the horizon, and are the MC/IC/ASC/DSC.
•In Mundo Points are based on the meridian or horizon only and are Culminate/AntiCulminate/Rise/Set.
TIP: You can toggle all four lines all on, or all off, at once - by repeatedly double-clicking anywhere in the Chart Points area.
NOTE: The South Node is deliberately disabled when plotting Astro maps because its lines would exactly overlay those of the North Node (except for the reversal of the Ascending / Descending and Culminating / Anticulminatings segments).
In fact the same is true for all points which belong to an "axis" pair but are not the primary axis point. Hence all of these points are intentionally disabled in Astro Maps:
•SouthNode
•Descendant
•ImumCoeli
•AntiVertex
•EqDsc
•CoDescendant
•PolarDescendant
•LibraPoint
2)As well, or instead of, Chart Points lines, you can choose Local Space lines.
➢ If you choose Local Space lines by clicking on Planetary Directions the lines will be the same regardless of the Chart Points you have chosen, and will include the chart angles.
Because Local Space lines emanate across the Map from the chart's actual location, it is necessary to change the chart's location to see how that would change the Local Space lines. To do this click on the Relocate button, and enter in the new chart location details.
 |
The map changes and the local space lines are redisplayed according to the new location.
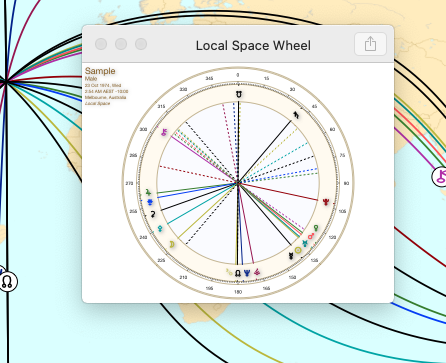
You can also display a Local Space Wheel (also called a Local Space Chart) on top of the map by clicking on the second of two small circles in the top right of the Maps screen.
 |
Clicking on the second small circle displays a small Local Space wheel window that sits on top of the map. Click on that small circle at the top of the screen again and the wheel is removed
By hovering the mouse over the left or right edge of the Local Space wheel window the cursor changes into a small double-pointed arrow. If you then click on the mouse button, and while continuing to hold it down, you can then drag the window edge to the left or right to make be whole window bigger or smaller.
 |
Finally, relocating the chart can be animated. This is done by clicking on the Cursor Relocation Mode button, shown below.
 Switching on Cursor Relocation Mode |
In cursor relocation mode, when you move the mouse over the map Astro Gold relocates the chart to where the mouse cursor is positioned, in real time. Therefore, when switched on, the Planetary Directions lines change to reflect the constantly changing relocation point on the map as the mouse is moved. And if the Local Space wheel is displayed it also updates in real time relevant to the constantly changing relocation point on the map as the mouse is moved.
When in cursor relocation mode, clicking on a location on the map fixes the chart wheel(s) and maps local space lines at that location (after which cursor relocation mode can be restarted, if still desired, by clicking on the cursor relocation mode button again).
Reference
1)In the Celestial group of lines you can opt to display for all locations where the Ecliptic lies, plus what Sign would be on the MC at any location, and what Sign would be on the ASC at any location. The signs are shown in the currently selected sign colors.
And to avoid ambiguity, if only lines for "Signs on ASC" is selected, or only "Signs on MC" is selected, whatever option is selected will be annotated at the edges of the map and also on the intersection with the ecliptic line.
If both options are selected, then only the "Signs for Asc" are annotated on their intersection with the ecliptic line.
2)In the Geographical group of lines you can opt to display the Equator and the Tropics.
3)Finally under Zodiacal Offset the "Geodetic" option affects the MC/IC/Asc/Desc lines, displacing them by a specified geodetic longitudinal offset.
That is, you can specify a meridian (longitude), and then the signs will align to 0 Aries being at that meridian. By default the meridian will be the the one at Greenwich, but you can enter any meridian and that will be used instead. If you click on the 3 dots to the right of the longitude textbox, a pop menu will be displayed allowing quick selection of the Greenwich meridian, the Pryamid of Giza meridian, or the most recently used meridian. See Geodetic Equivalents for more info.
Parans occur when two points are simultaneously conjunct different chart angles e.g. Venus is on the ASC while Saturn is on the MC. In the local space reference a paran is formed whenever two planetary lines cross.
➢ To show Paran lines click on the Parans tab then in the Show Parans checkbox until it has a tick in it. To turn Paran lines off click in the Show Parans checkbox until it doesn't have a tick in it.
The first time you show Paran lines all the possible parans for every planet will be displayed, which is a huge amount of information which might cover most of a screen. Therefore it's best to either use the filtering options, or else to zoom into the map to an area of interest as much as possible, to avoid overcrowding of the display. To filter the paran lines turn on one of the following filters by clicking its checkbox until it has a tick in it. To turn the filter off click its checkbox until it doesn't have a tick in it.
Paran Filters
You can select one or the other, or neither, of these filters.
a)Rise/Set to Rise/Set only
These lines show the latitude where each respective pair of planets will both be either rising (on the ASC) at the same time, one rising and one setting (on the DESC), or both setting.
b)Rise/Set to Culm/ACulm only
These lines show the latitude where each respective pair of planets will be either one rising and one culminating (on the MC), or one rising and one anti-culminating (on the IC), one setting and one culminating (on the MC), or one setting and one anti-culminating (on the IC).
Point Filter
You can select parans involving just one point in Parans only of Point.
Latitude Filter
You can limit parans to a specific band of latitude north and south of the equator e.g. from 15°N to 15°S. For that you would enter 15 into the Limit of Latitude textbox.
Aspects are an important part of astro locality mapping, with the conjunction to the angles being the most important. Other aspects to the chart angles also provide significance however.
To display Aspect Lines click in the Show Aspects checkbox until it is ticked, likewise to turn aspect lines off click it until it isn't ticked.
The orb influence group for aspects are:
Strong influence = orb less than 1/3 of the maximum orb for the given aspect
Medium influence = orb between 1/3 and 2/3 of the maximum orb for the given aspect
Weak influence = orb greater than 2/3 of the maximum orb for the given aspect
1 degree of orb corresponds to 1/360th of the circumference of earth, i.e. about 110km.
>> To search for and display Eclipses
➢ Click on the Eclipses button. This opens the "Eclipse Search" dialog where you can search for Solar eclipses.
|
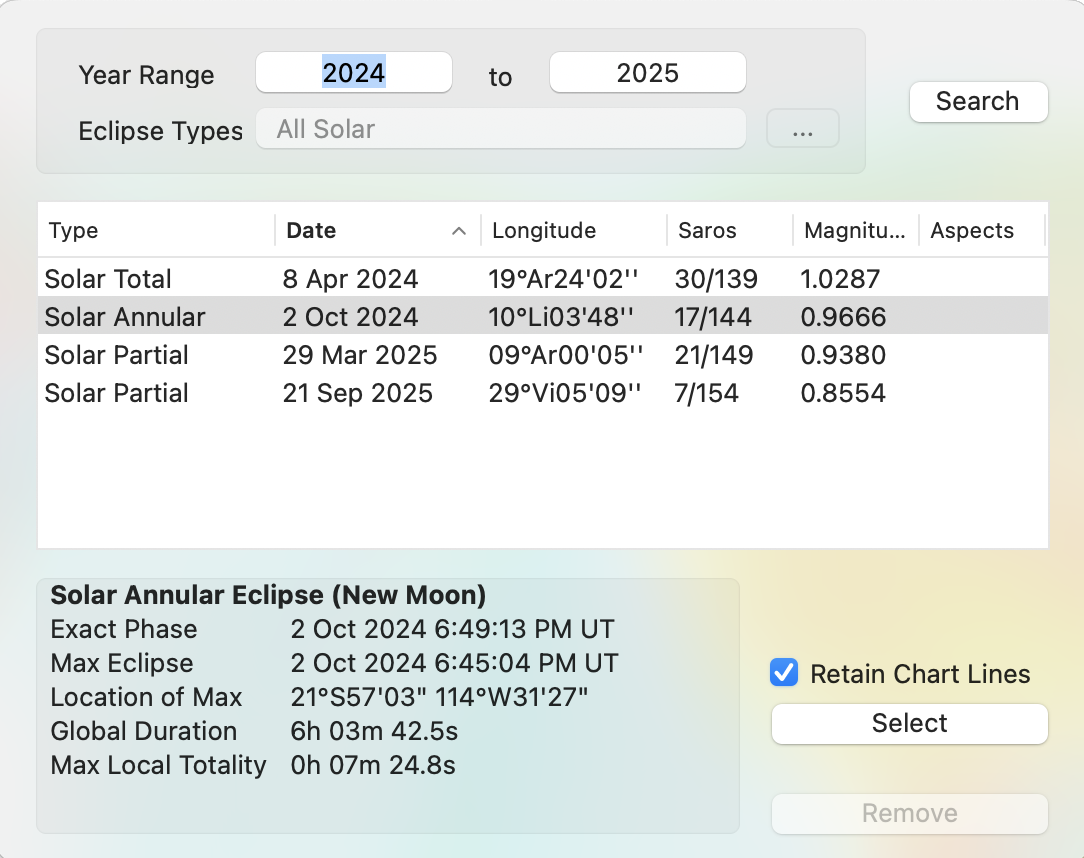
1)Set the Year Range.
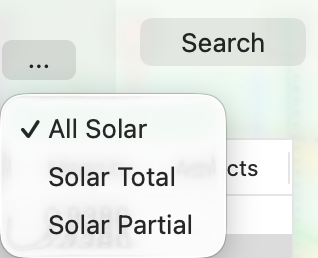
2)Choose the Eclipse Types. To change the type of Solar eclipse to search for click on the three dots to the right of the "Eclipse Types" textbox.
|
3)Click on the Search button, and any eclipses found will be displayed in the list.
4)Select which list you want to display on the map by clicking on it.
5)Before displaying the eclipse lines on the map - if you want the currently selected map lines to stay drawn on the map click in the Retain Chart Lines checkbox until a tick appears (and vice versa).
6)Click on the Select button and the selected eclipse lines will be displayed on the map.
7)To remove the eclipse lines form the map, click on the Eclipses button and then on the Remove button at the bottom of the "Eclipse Search" dialog.
>> To activate CycloCartoGraphy (the Chart Stepper)
1)In the top left of the Maps screen click on the Charts button, then choose a dynamic type chart (transits, progressions etc) to display in the map (unless you already are displaying a dynamic type chart). If no charts are of a dynamic type you'll need to select one in the Chart Details area in the Main Screen, then come back to this.
2)Click on the Chart Stepper icon  in the Maps window Toolbar (the shortcut is to simultaneously press the Option+Command+right arrow keys).
3)The "Chart Stepper" is an exact replica of the Chart Stepping facility on the main screen. For info on how to use it see Stepping through time.
4)One way to make use of this facility is to display a natal chart in the Map, then display one or more dynamic charts (say a progressed chart and transits chart) for that natal chart in their own separate Maps windows (to do that click on the "New Window" icon in the top right corner of the Map window title bar for each dynamic chart you want to display in its own separate window). Then when you use the "Chart Stepper" to step through time the dynamic chart maps will be displayed in windows on top of the main map which is displaying the natal chart.
>> To relocate Local Space Lines on the map
1)If you have local space lines (e.g. Planetary Directions) turned on then you can change what location on the map they originate from by clicking on the Relocate button.
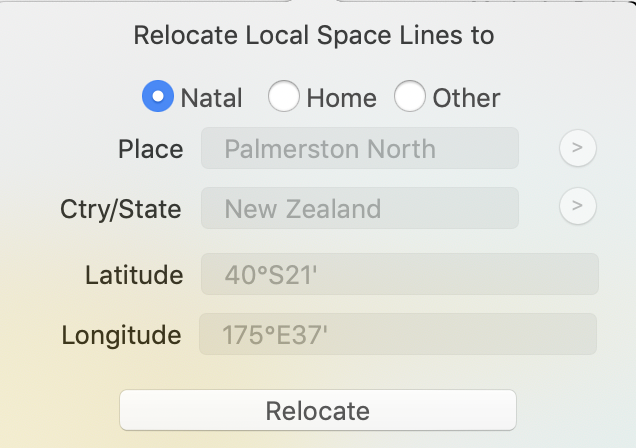
2)In the "Relocate" dialog you can quickly select the radix chart location (the Natal option), or the Home location (the default app location), or enter a new location (Other option).
3)Click on the Relocate button and the local space lines will be redrawn from that new location.
>> To determine coordinates of and distances between specific places on the Map
Use the Angular Distance measuring tool...
1)Click once anywhere on the Map to engage the tool.
2)Now, wherever you hover the mouse the coordinates of the place you are hovering over will be shown at center of the bottom of the Map.
3)To see the distance between two locations click on the first location and either:
a)holding the right mouse button down OR holding the Control key and the left mouse button both down ...
b)drag the mouse to the other location and stop there. A line will be drawn between the two locations, and the distance will be measured in degrees, kilometers and miles and displayed at the bottom center of the Maps window.
>> To get interpretations
1)For individual planets and signs click on the planet's or sign's symbol in the line or at the end of the line. Specific interpretation text for that line will pop up.
2)To get a full report about the effect of relocating to somewhere on the globe other than the chart's location click on the Report button. Enter the location details of the place you're interested in, then click on the Generate PDF button.
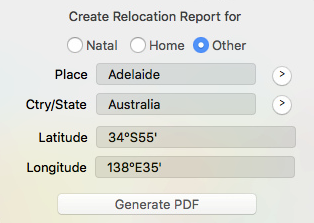 |
As well as the Planet/Angle (Astro*Carto*Graphy) and Planet Direction (Local Space) lines, a section in the report will include a listing of any Paran lines within a 2 degree orb of the selected location to relocate to.
NOTE: The fixed maximum orb used for azimuths in relocation reports is 10 degrees. This is split into 3 equal parts to determine what are classified as strong, medium and weak aspects.
>> To Save, Copy, Print or Share the Map
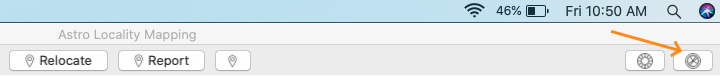
➢ Click on the Action button  at the top right. A menu will drop down, giving you these options and more. See Printing for more information about printing the map or saving it to a PDF file.
 Map; Action button menu |